HOT TOPICS LIST
- MACD
- Fibonacci
- RSI
- Gann
- ADXR
- Stochastics
- Volume
- Triangles
- Futures
- Cycles
- Volatility
- ZIGZAG
- MESA
- Retracement
- Aroon
INDICATORS LIST
LIST OF TOPICS
PRINT THIS ARTICLE
by Mark Rivest
Learn how the Mexican stock market is giving clues to a multi-month rally for crude oil and stock markets of other nations.
Position: N/A
Mark Rivest
Independent investment advisor, trader and writer. He has written articles for Technical Analysis of Stocks & Commodities, Traders.com Advantage,Futuresmag.com and, Finance Magnates. Author of website Four Dimension Trading.
PRINT THIS ARTICLE
MOMENTUM
Mexico, the Secret Bull Market Indicator
03/09/16 05:40:56 PMby Mark Rivest
Learn how the Mexican stock market is giving clues to a multi-month rally for crude oil and stock markets of other nations.
Position: N/A
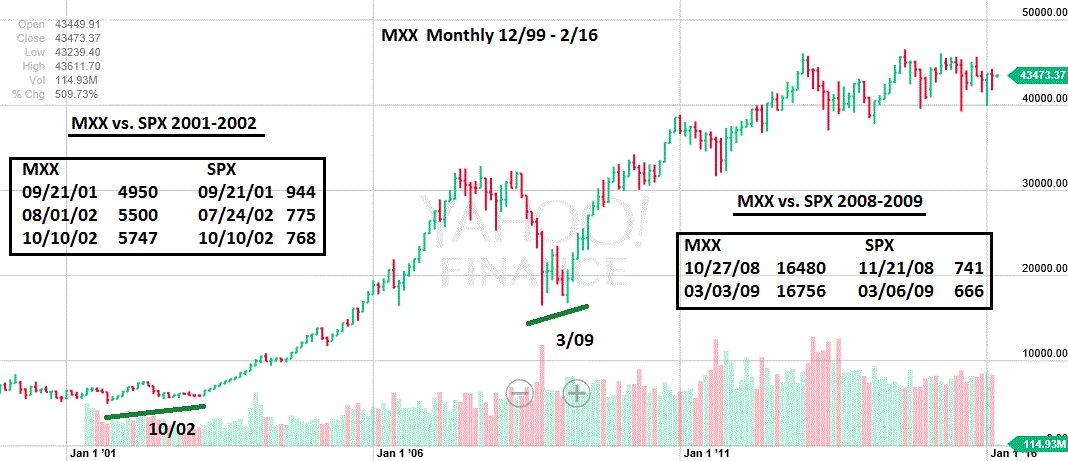
| Twice within the last fifteen years the Mexican stock market (MXX) has given very reliable bullish signals that have indicated important bottoms for the U.S and other nations stock markets. In February 2016 the MXX has flashed a bullish signal that has implications not only for stocks but also for crude oil. Long Term View Mexico's economy is not one of the largest nor is it one of the smallest. Their GDP world rank is 15th out of 188. They are, however, one of only two nations that border the United States. The U.S. is Mexico's top export destination. Mexico is USA's third largest trading partner. Mexico's largest export is crude oil. You would expect that if the U.S. economy were to weaken that the effect on the Mexican economy and stock market would be even more severe. Stock markets are leading economic indicators, so if you were to see the Mexican stock market begin to outperform the U.S. stock market it would be a major clue that not only the Mexican economy was in reasonably good shape, but the U.S. economy as well. Please see the monthly MXX chart illustrated in Figure 1. This chart goes back to late 1999 and illustrates the two MXX bullish divergences vs. the S&P 500 (SPX). The first is the bottom of the major bear market that began in early 2000. While the main U.S stock indices bottomed in October 2002, the MXX bottomed in September 2001 and had a double bullish divergence vs. the SPX in 2002. The second time the MXX was outperforming the main U.S stock indices was near the end of "The Great Recession" bear market of 2007-2009. In this situation, the MXX bottomed more than four months before the SPX. Buying stocks off of both of these signals would have reaped you an abundant harvest of profits. |

|
| Figure 1. MXX had two major bullish divergences vs. the SPX. |
| Graphic provided by: Yahoo! Finance. |
| |
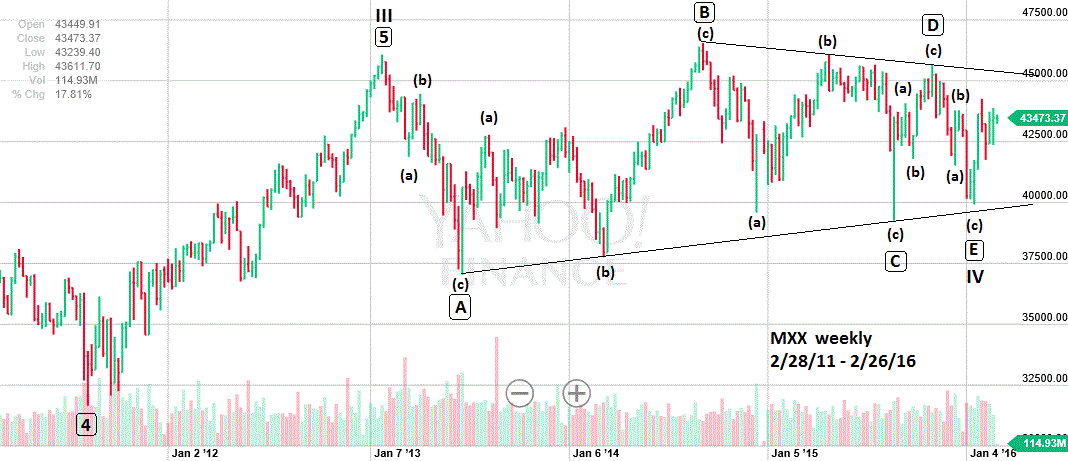
| Intermediate Term View The MXX appears to have completed a nearly three year Elliott wave Horizontal Triangle. Please see the weekly MXX chart illustrated in Figure 2. This is a near textbook example of a Horizontal Triangle. The trend lines are nearly perfect with only wave "E" marginally missing the lower line. Additionally, there are Fibonacci relationships among the sub waves. The lengths of each sub wave are; "A'" = 9040, "B" = 9520, "C" = 7297, "D" = 6423, and "E" = 5756. ("E" 5756/ "B" 9520 = .604 close to .618. "A" 9040/"C" 7297 = 1.238 close to 1.236 "A" 9040/ "B" 9520 = .95 which is tending towards equality.) If the MXX Horizontal Triangle is complete, then a post triangle thrust up is underway. Many times the widest part of the triangle added to the end of wave "E" can target the completion of the post triangle thrust. Using points to measure the thrust — wave "B" was 9520 points added to the low of wave "E" at 39924 targets MXX 49444. If we use the percentage gain of wave "B" 25.7% x 39924= 10263 + 39924 = MXX 50187. |

|
| Figure 2. This is a near textbook example of a Horizontal Triangle. |
| Graphic provided by: Yahoo! Finance. |
| |
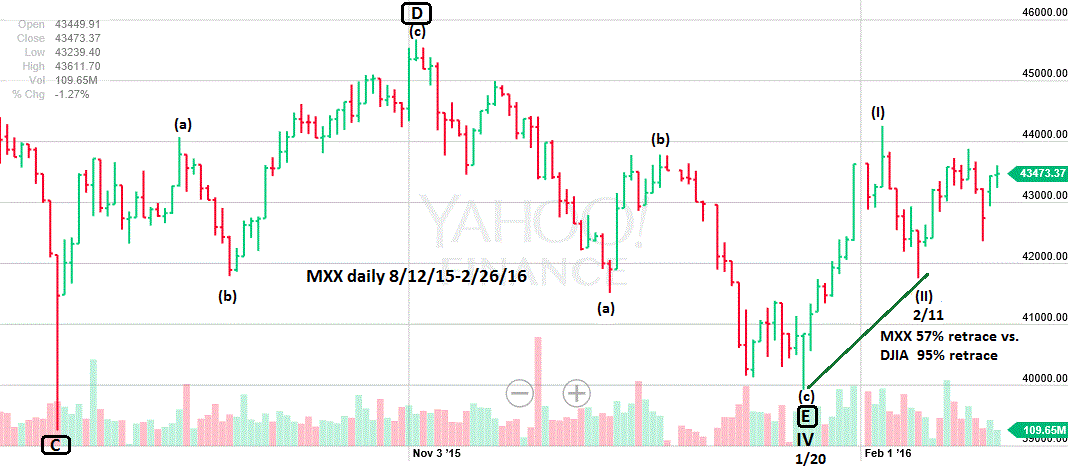
| Short Term View Both bear markets of 2000-2002 and 2007-2009 lasted more than a year, correspondingly the MXX bullish signals heralded bull markets that went on for years. The SPX 2015-2016 decline was only a little more the eight months so the supposed current MXX bullish signal is probably the start of only a multi-month rally. February 2016 saw both the SPX and Nasdaq make new bear market lows while the MXX had a double bullish divergence vs. its August 2015 bottom. Please see the daily MXX chart illustrated in Figure 3. What about the Dow Jones Industrial Average (DJIA)? It also has a double bullish divergence vs. its August 2015 bottom. The DJIA retraced 95% of the rally off of the January 20th bottom while the MXX retraced only 57% of its post January 20th rally. The MXX is out performing even the bluest of blue chip US stocks. |

|
| Figure 3. The MXX is out performing even the bluest of blue chip U.S stocks. |
| Graphic provided by: Yahoo! Finance. |
| |
| Summary My February 25th article "Bullish Divergences Abound" noted that there were many bullish momentum divergences for stocks and crude oil. Let's, for the moment, forget about all those bullish divergences — Forget about the bullish DJIA Elliott wave pattern. Forget that the SPX recent bottom at 1810 was in a major support zone, and just focus on Mexico. If crude oil is supposed to be headed to $20 a barrel, or even lower, why isn't the Mexican economy imploding along with its stock market? Perhaps what's happening in the MXX is yet another sign that Crude Oil has hit an important bottom and is now in the early phase of a new bull market? If the U.S. is on the verge of an economic decline wouldn't this be spilling over into the Mexican economy, which would show up first in their stock market by significantly underperforming U.S stocks? Yet the exact opposite is happening! The evidence from the MXX alone is a table pounding clue that most stock markets around the world and crude oil are in the early phase of bull markets that could last several months. It would have been wise to follow the MXX signals in 2002 and 2009. Following the 2016 signal could lead to reaping an abundant harvest of profits! Further reading: Frost A.J and Robert Prechter (1985) "Elliott Wave Principle", New Classics Library. |
Independent investment advisor, trader and writer. He has written articles for Technical Analysis of Stocks & Commodities, Traders.com Advantage,Futuresmag.com and, Finance Magnates. Author of website Four Dimension Trading.
| Website: | www.fourdimensiontrading.com |
| E-mail address: | markrivest@gmail.com |
Click here for more information about our publications!
Comments

Request Information From Our Sponsors
- StockCharts.com, Inc.
- Candle Patterns
- Candlestick Charting Explained
- Intermarket Technical Analysis
- John Murphy on Chart Analysis
- John Murphy's Chart Pattern Recognition
- John Murphy's Market Message
- MurphyExplainsMarketAnalysis-Intermarket Analysis
- MurphyExplainsMarketAnalysis-Visual Analysis
- StockCharts.com
- Technical Analysis of the Financial Markets
- The Visual Investor
- VectorVest, Inc.
- Executive Premier Workshop
- One-Day Options Course
- OptionsPro
- Retirement Income Workshop
- Sure-Fire Trading Systems (VectorVest, Inc.)
- Trading as a Business Workshop
- VectorVest 7 EOD
- VectorVest 7 RealTime/IntraDay
- VectorVest AutoTester
- VectorVest Educational Services
- VectorVest OnLine
- VectorVest Options Analyzer
- VectorVest ProGraphics v6.0
- VectorVest ProTrader 7
- VectorVest RealTime Derby Tool
- VectorVest Simulator
- VectorVest Variator
- VectorVest Watchdog
