

HOT TOPICS LIST
- MACD
- Fibonacci
- RSI
- Gann
- ADXR
- Stochastics
- Volume
- Triangles
- Futures
- Cycles
- Volatility
- ZIGZAG
- MESA
- Retracement
- Aroon
INDICATORS LIST
LIST OF TOPICS
PRINT THIS ARTICLE
by Mark Rivest
See why May 2017 could be a major top for the US stock market.
Position: N/A
Mark Rivest
Independent investment advisor, trader and writer. He has written articles for Technical Analysis of Stocks & Commodities, Traders.com Advantage,Futuresmag.com and, Finance Magnates. Author of website Four Dimension Trading.
PRINT THIS ARTICLE
MARKET TIMING
Termination Date
04/12/17 04:39:46 PMby Mark Rivest
See why May 2017 could be a major top for the US stock market.
Position: N/A
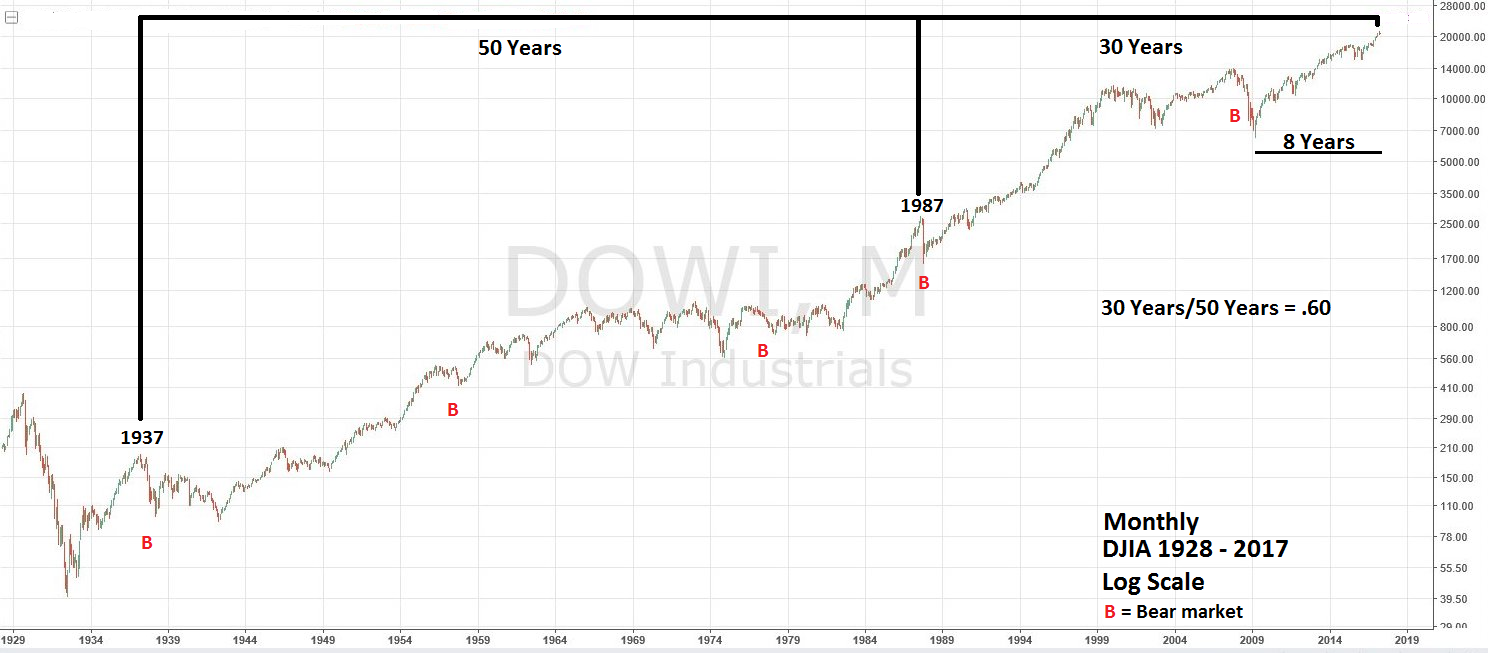
| A combination of long-term time cycles, Fibonacci time ratios and stock market seasonality all point to May 2017 as a potential major top for the US stock market. A major top implies at least a 50% decline, lasting from two to five years. If the US stock bull market terminates in May 2017 it could be a long time before current prices are seen again. Dow Jones Industrial Average — Long Term Two timing methodologies point to 2017 as a year in which a major peak could happen, the "decennial pattern" and the Fibonacci time sequence. Please see the Monthly Dow Jones Industrial Average (DJIA) chart illustrated in Figure 1. Decennial pattern: This theory states that years ending in 3,7 and 10 are down years for the stock market. Years ending in 5,8 and 9 are advancing years. This pattern has been effective for over a hundred years except for years ending in 5. Up until 1995 "5" years had the strongest bull moves in their respective decades. After the powerful upside performance in 1995, the majority anticipated 2005 to be a powerful up year — it was mediocre, the same for 2015. At some point all cycles and patterns end because of anticipation by the crowd. Years ending in 7 continue to have an impressive track record of being bearish, this is the record: 1907 - bear market 1917 - bear market 1937 - bear market 1957 - bear market 1977 - bear market 1987 - crash 2007- major top/start of bear market Seven out of the last eleven years ending in 7 there have been significant declines or the start of a major decline. Fibonacci time sequence: R.N. Elliott discovered the wave principle and that markets move in time segments related to the Fibonacci sequence (1, 1, 2, 3, 5, 8, 13 ,21, 34, 55, 89, 144, to infinity). Elliott noted that the 1929-1932 bear market was 34 months, the 1932-1937 bull market was 5 years, and the 1937-1942 bear market was 5 years. Decades later Robert Prechter Jr. illustrated in his book, "Beautiful Pictures", many more examples of the Fibonacci time sequence for the stock market during the Twentieth Century. This is the record of DJIA bull/bear markets since 1932. 1932-1937 - 5-year bull market 1937-1942 - 5-year bear market 1942- 1966 - 34-year secular bull market 1970 - 1973 - 3-year bull market 1974- 1987 - 13-year secular bull market 1987- 2000 - 13-year secular bull market 2000 - 2002 - 34-month bear market 2002 -2007 - 5-year bull market 2009 - 2017 - 8-year bull market. These are just the major moves. There are many more examples on smaller time scales. In addition, 2017 has a Fibonacci time ratio with the two most infamous "7" years, 1937 and 1987. The decennial cycle, Fibonacci time sequence, and ratio all point to 2017 as potentially being a major top. |
|
| Figure 1. 2017 has a Fibonacci time ratio with the two most infamous �7� years: 1937 and 1987. |
| Graphic provided by: Tradingview.com. |
| |
| Seasonal Factor Sell in May and go away, is not a stock market cliche. Statistically, the best upside performance for US stocks is from November to April. Please see the Monthly S&P 500 (SPX) chart illustrated in Figure 2. The four largest declines since the bull market began were preceded by peaks in either April or May. 2013, 2014, and 2016 had mediocre upside moves in the May-October period. Only 2009 had strong upside May-October performance. Seasonality favors a top in the April/May 2017 period. In addition, there is a Fibonacci time ratio from the May 2011 peak and May 2015 peak that points to May 2017 as a potential top. |
|
| Figure 2. The four largest declines since the bull market began were preceded by peaks in either April or May. |
| Graphic provided by: BigCharts.com. |
| |
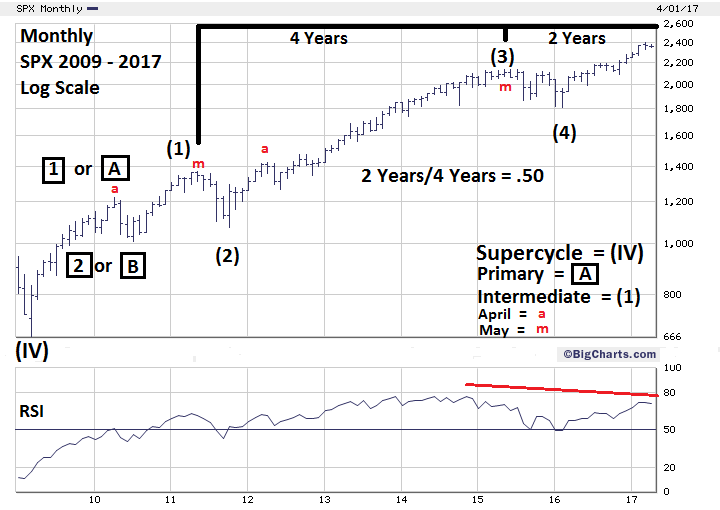
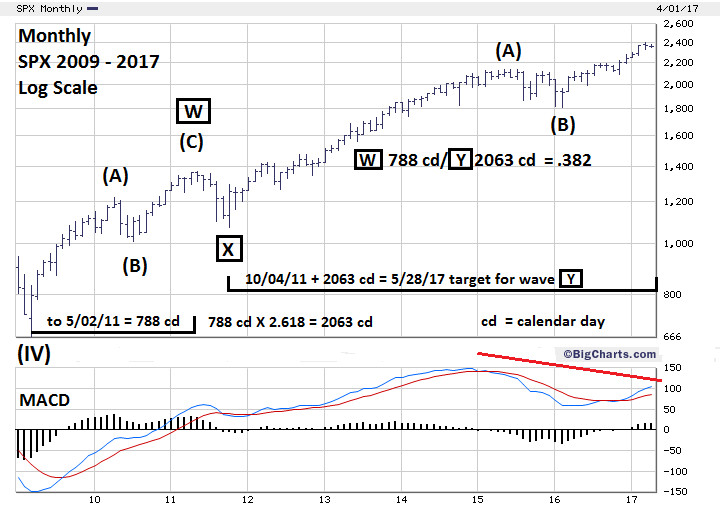
| Alternate Elliott Wave Counts There are two basic patterns in Elliott wave theory: five and three waves structures. The first monthly SPX chart illustrates two possible wave counts from the 2009 bottom. One count could be that a three wave A-B-C is forming with the supposed primary wave "B" bottom in 2010. If this count is correct it implies primary wave "C" has topped, or is topping, forming a major peak prior to a multi-year drop. An alternative, less bearish, count has primary wave "3" topping with only a multi month decline about the size of the 2010 correction. The correction would be labeled as primary wave "4" setting the stage for a final primary wave "5" rally taking the SPX above the top of primary wave "3". The problem with both these counts is that the 2011 correction, labeled as an intermediate degree wave, is larger in both price and time than the smaller primary degree correction of 2010. Most of the time intermediate degree corrections are smaller in price and time to primary degree corrections. The answer could be in a third alternate count. Please see the Monthly SPX chart illustrated in Figure 3. Sometimes three wave patterns can sub-divide into two separate three wave patterns, referred to as a Double Zigzag. In this count the 2011 bottom is a primary degree "X" wave acting as the nexus for the two rallies of the entire bull market from 2009. This count also reveals a fascinating Fibonacci time ratio that targets Sunday May 28, 2017, as the termination point for the bull market from 2009. Because the SPX is not trading on that day, May 26th or May 30th are the bulls-eye target days. |
|
| Figure 3. In this count the 2011 bottom is a primary degree �X� wave acting as the nexus for the two rallies of the entire bull market from 2009. |
| Graphic provided by: BigCharts.com. |
| |
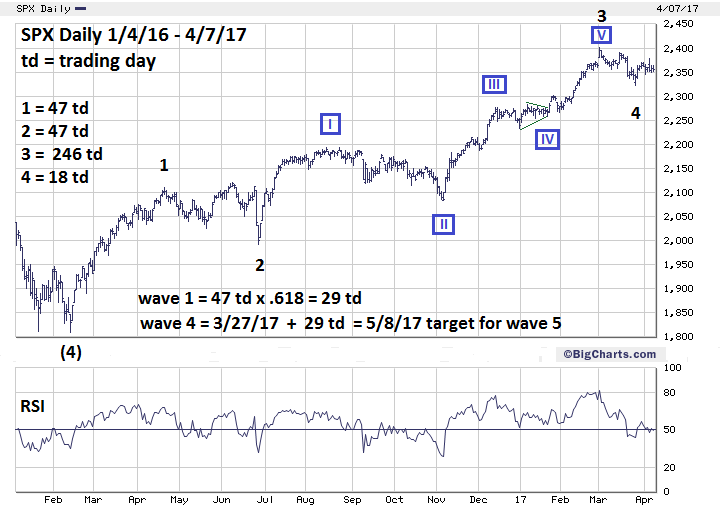
| S&P 500 Daily Please see the Daily SPX chart illustrated in Figure 4. Within the last ten months two SPX turns have been forecasted with pinpoint accuracy using Fibonacci time analysis: the June 27, 2016 Brexit bottom and the recent March 27th bottom. Please see my June 24, 2016, article "The Brexit Factor" and my March 22, 2017 article "Bond Yield Decision Point". Wave "One" usually has a Fibonacci relationship with wave "Five"; either .382, .50, .618 or equality 1.00. Minor wave "1" was 47 trading days. 47 x .382 = 18 + March 27 = April 21 47 x .50 = 24 + March 27 = May 1 47 x .618 = 29 + March 27 = May 8 47 x 1.00 = 47 + March 27 = June 2 Any larger Fibonacci ratios push the target dates beyond the seasonal time zone. The two prior May peaks since 2009 were May 2, 2011, and May 20, 2015. Perhaps the SPX will split the difference of these dates and top on May 8, 2017? |
|
| Figure 4. Wave �One� usually has a Fibonacci relationship with wave �Five�. |
| Graphic provided by: BigCharts.com. |
| |
| Summary An overwhelming amount of evidence measured in decades, years, months and days point to 2017 and May as a time when US stocks could put in a major top. This is just the time dimension; there's equal amounts of evidence from the other three dimensions of price, momentum and sentiment that also indicate a major peak forming for US stocks. These other factors will be examined in future articles. The message from the time dimension — stock market bulls are nearly out of time. Further Reading: Frost A.J and Robert Prechter (1985) "Elliott Wave Principle", New Classics Library. Prechter Jr. R. Robert (2003) "Beautiful Pictures", New Classics Library. |
Independent investment advisor, trader and writer. He has written articles for Technical Analysis of Stocks & Commodities, Traders.com Advantage,Futuresmag.com and, Finance Magnates. Author of website Four Dimension Trading.
| Website: | www.fourdimensiontrading.com |
| E-mail address: | markrivest@gmail.com |
Click here for more information about our publications!
Comments
Date:�04/13/17Rank:�5Comment:�Great!

Request Information From Our Sponsors
- StockCharts.com, Inc.
- Candle Patterns
- Candlestick Charting Explained
- Intermarket Technical Analysis
- John Murphy on Chart Analysis
- John Murphy's Chart Pattern Recognition
- John Murphy's Market Message
- MurphyExplainsMarketAnalysis-Intermarket Analysis
- MurphyExplainsMarketAnalysis-Visual Analysis
- StockCharts.com
- Technical Analysis of the Financial Markets
- The Visual Investor
- VectorVest, Inc.
- Executive Premier Workshop
- One-Day Options Course
- OptionsPro
- Retirement Income Workshop
- Sure-Fire Trading Systems (VectorVest, Inc.)
- Trading as a Business Workshop
- VectorVest 7 EOD
- VectorVest 7 RealTime/IntraDay
- VectorVest AutoTester
- VectorVest Educational Services
- VectorVest OnLine
- VectorVest Options Analyzer
- VectorVest ProGraphics v6.0
- VectorVest ProTrader 7
- VectorVest RealTime Derby Tool
- VectorVest Simulator
- VectorVest Variator
- VectorVest Watchdog