HOT TOPICS LIST
- MACD
- Fibonacci
- RSI
- Gann
- ADXR
- Stochastics
- Volume
- Triangles
- Futures
- Cycles
- Volatility
- ZIGZAG
- MESA
- Retracement
- Aroon
INDICATORS LIST
LIST OF TOPICS
PRINT THIS ARTICLE
by Mark Rivest
How to use stock market sentiment indicators.
Position: N/A
Mark Rivest
Independent investment advisor, trader and writer. He has written articles for Technical Analysis of Stocks & Commodities, Traders.com Advantage,Futuresmag.com and, Finance Magnates. Author of website Four Dimension Trading.
PRINT THIS ARTICLE
SENTIMENT INDEX
Sentimental Journey
05/03/17 04:39:05 PMby Mark Rivest
How to use stock market sentiment indicators.
Position: N/A
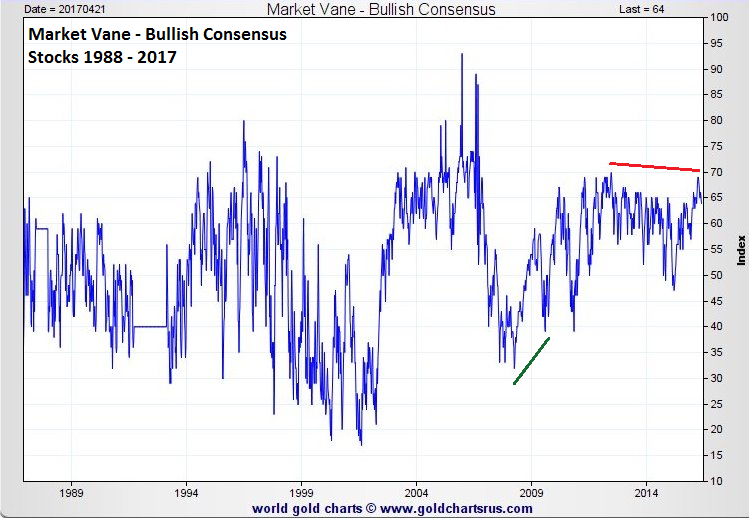
| If the US stock market, and in particular the S&P 500 (SPX), can make a new all-time high sometime in May 2017 it could be a major peak that may not be exceeded for several years. Indicators from the dimension of sentiment could give additional evidence of a major top forming for stocks. Market Vane - Bullish Consensus Please see the Market Vane chart illustrated in Figure 1. R. Earl Hadady developed the Market Vane-Bullish Consensus in which futures traders in various markets are polled as to their opinion about the markets they trade. A very high bullish reading indicates a potential market top. A very low reading means a possible bottom. For US stocks, generally readings over 60% indicate nearing a topping zone. While extreme readings can signal a trend change, the best signals come on divergences. Note the bullish divergence made at the major 2009 stock market bottom vs. the lowest reading made in 2008. This indicates that in 2009 futures traders were more bullish on the US stock market and a signal of a potential move up in stocks. For 2017, the highest Bullish Consensus reading for stocks came on the week of February 27, 2017, with a reading of 69%. The highest reading for US stocks since the bull market began in 2009 is a reading of 70% made in the week of May 17, 2013. If US stocks were to exceed the all-time high made on March 1, 2017, and the bearish divergence was to continue, it could be another signal of a major top. |

|
| Figure 1. For US stocks, generally readings over 60% indicate nearing a topping zone. |
| Graphic provided by: goldchartsrus.com. |
| |
| AAII- Stock Market Bullish Index Please see the AAII Bullish index illustrated in Figure 2. This chart shows a more dramatic double bearish divergence for the US stock bull market since 2009. It is doubtful that this index could exceed even its first bearish divergence made in 2014. This is a powerful signal that underneath the surface bearish sentiment is growing. |

|
| Figure 2. This is a powerful signal that underneath the surface bearish sentiment is growing. |
| Graphic provided by: goldchartsrus.com. |
| |
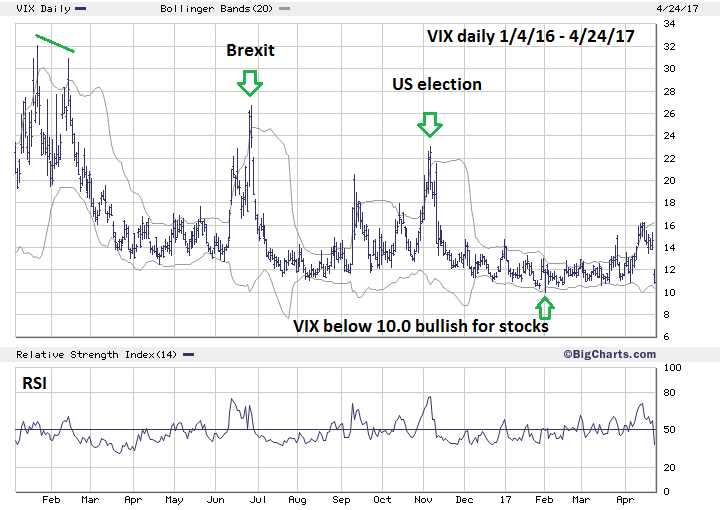
| VIX - Daily Please see the daily VIX chart illustrated in Figure 3. In several of my articles I've noted how the VIX can be used to discover stock market turns. The VIX is a great tool to use in detecting stock market bottoms especially when used with Bollinger bands. Spikes above the upper Bollinger band usually indicate a bottom. It's more difficult using the VIX to discover stock market tops. Almost all the time, moves to new lows indicates the stock market rally will continue. Note what happened after the last VIX bottom made in early February 2017. It takes at least one VIX bottom divergence, usually two or three, before a stock market top is made. If the February VIX bottom at 10.0 is breached it would be a strong signal the stock market rally could continue. If the SPX was to exceed its March 1st peak at 2401.00 with a VIX divergence, it could be yet another sign of a major stock peak forming. |

|
| Figure 3. It takes at least one VIX bottom divergence, usually two or three, before a stock market top is made. |
| Graphic provided by: BigCharts.com. |
| |
| Conclusion Of the four market dimensions — Price, Time, Momentum, and Sentiment — the most difficult to use in stock bull markets is sentiment. In stock markets the emotion of fear is more intense than hope/greed. Fear spikes making is easy to recognize stock market bottoms. Hope/greed is more diffused; extreme bullish reading could continue for months, therefore sentiment readings must be used in conjunction with readings from the other three market dimensions. In particular, the dimension of time. As of the week of April 18, 2017, the Market Vane-Bullish Consensus reading for stocks has been over 60% for 23 consecutive weeks. This is the second longest streak of over 60% readings since November 30, 2012-June 21, 2013, which was 30 consecutive weeks. This is logical since it came during the most powerful phase of the 2009-2017 bull market. This is the recognition phase of the bull market, please see my April 21st article "Global Non-Confirmation" for an explanation of the three bull market phases. If the Market Vane Bullish Consensus does not exceed 30 consecutive weeks above 60% and records two consecutive readings below 60%, it could be another signal that sentiment has shifted. If a major stock market peak is made in May 2017, years from now the 2009-2017 bull market will be viewed as a sentimental journey. For those market participants that ignore the many signs of a potential market top, they could end up viewing the next few years as "the highway to hell". Further Reading: Hadady R. Earl (1983) "Contrary Opinion", Key Books. |
Independent investment advisor, trader and writer. He has written articles for Technical Analysis of Stocks & Commodities, Traders.com Advantage,Futuresmag.com and, Finance Magnates. Author of website Four Dimension Trading.
| Website: | www.fourdimensiontrading.com |
| E-mail address: | markrivest@gmail.com |
Click here for more information about our publications!
Comments

Request Information From Our Sponsors
- StockCharts.com, Inc.
- Candle Patterns
- Candlestick Charting Explained
- Intermarket Technical Analysis
- John Murphy on Chart Analysis
- John Murphy's Chart Pattern Recognition
- John Murphy's Market Message
- MurphyExplainsMarketAnalysis-Intermarket Analysis
- MurphyExplainsMarketAnalysis-Visual Analysis
- StockCharts.com
- Technical Analysis of the Financial Markets
- The Visual Investor
- VectorVest, Inc.
- Executive Premier Workshop
- One-Day Options Course
- OptionsPro
- Retirement Income Workshop
- Sure-Fire Trading Systems (VectorVest, Inc.)
- Trading as a Business Workshop
- VectorVest 7 EOD
- VectorVest 7 RealTime/IntraDay
- VectorVest AutoTester
- VectorVest Educational Services
- VectorVest OnLine
- VectorVest Options Analyzer
- VectorVest ProGraphics v6.0
- VectorVest ProTrader 7
- VectorVest RealTime Derby Tool
- VectorVest Simulator
- VectorVest Variator
- VectorVest Watchdog
