HOT TOPICS LIST
- MACD
- Fibonacci
- RSI
- Gann
- ADXR
- Stochastics
- Volume
- Triangles
- Futures
- Cycles
- Volatility
- ZIGZAG
- MESA
- Retracement
- Aroon
INDICATORS LIST
LIST OF TOPICS
PRINT THIS ARTICLE
by Mark Rivest
Three Fibonacci price coordinates could indicate the end of the eight-year stock bull market.
Position: Sell
Mark Rivest
Independent investment advisor, trader and writer. He has written articles for Technical Analysis of Stocks & Commodities, Traders.com Advantage,Futuresmag.com and, Finance Magnates. Author of website Four Dimension Trading.
PRINT THIS ARTICLE
SUPPORT & RESISTANCE
The Price is Right
05/10/17 03:45:42 PMby Mark Rivest
Three Fibonacci price coordinates could indicate the end of the eight-year stock bull market.
Position: Sell
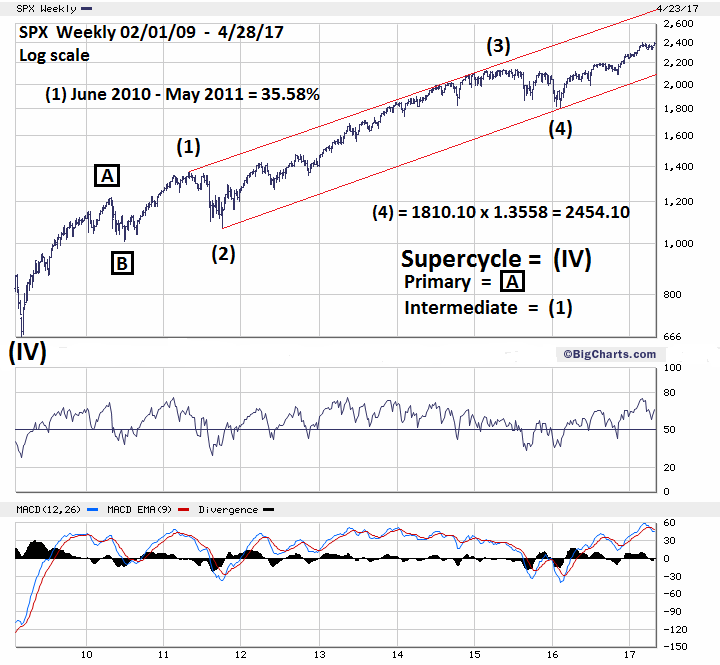
| Fibonacci price retracements and projections act as magnets drawing markets towards them. Many times, after a market has reached a Fibonacci coordinate the trend will reverse. Two or more Fibonacci coordinates close together increases their magnetic power. In early May 2017, the S&P 500 (SPX) is near three Fibonacci coordinates, one which dates back more than six years. This implies that a potential trend change could last for several years. A possible SPX trend change in May 2017 could be the most significant since the major bottom in March 2009. S&P 500 Long and Intermediate Term Please see the weekly SPX chart illustrated in Figure 1. This is an update to the weekly SPX chart illustrated in my March 15th article "Discovering Fibonacci Price Targets". When using Fibonacci price analysis on any market, start with long term price structures, roughly two to ten years long. Whenever more than one Fibonacci price coordinate is discovered, the largest price coordinate is primary. The potential turn from a primary coordinate is related to the size of the price structure. In the SPX bull market from 2009 the primary coordinate derives from the relationship to price structure formed over six years ago. This implies that a move down from the primary coordinate could last at least one year. The SPX from the June 2010 bottom at 1010.90 appears to be forming an Elliott five wave pattern. If so, the rally from June 2010 to May 2011 could be Intermediate wave (1). Within the five-wave structure the most likely relationship of wave "one" to "five" is equality. The June 2010 to May 2011 rally was 35.58%. Adding this growth rate to the supposed Intermediate wave (4) bottom at 1810.10 targets SPX 2454.10 as the termination point for Intermediate wave (5) and the primary Fibonacci price coordinate. The next step is to discover if there is a secondary Fibonacci coordinate near the primary. In this case, we would be examining intermediate term price structures of roughly one to two years long. As noted in the March 15th article, the SPX Intermediate wave (3) peak in May 2015 at 2134.70 to the Intermediate wave (4) bottom is 324.60 points. 324.60 x 2 = 649.20 added to the Intermediate wave (4) bottom of 1810.10 targets 2459.30 amazingly close to the primary coordinate of 2454.10. Note the upper trendline rising from the SPX May 2011 peak. If the Fibonacci coordinates do not stop the bull market perhaps the trendline currently in the 2600 area could be resistance. More about this in a future article if necessary. |

|
| Figure 1. When using Fibonacci price analysis on any market, start with long term price structures, roughly two to ten years long. |
| Graphic provided by: Bigcharts.com. |
| |
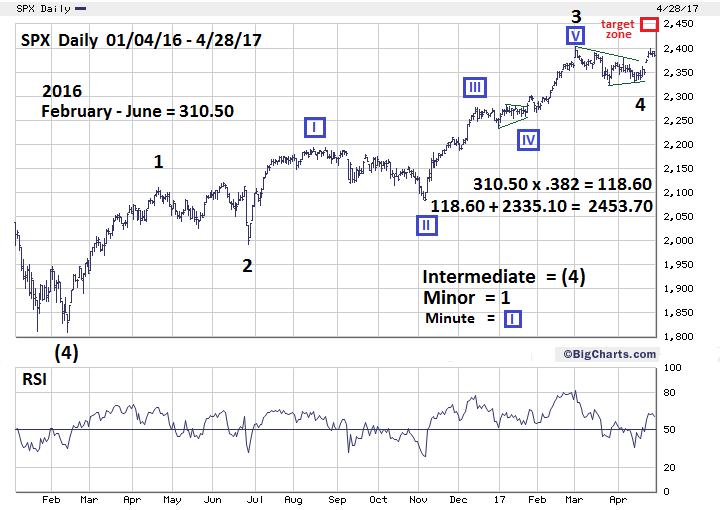
| S&P 500 Short-Term Please see the daily SPX chart illustrated in Figure 2. The next step is discovering a tertiary Fibonacci coordinate. In this situation examine the short-term price structure, roughly two to eighteen months. The daily SPX since the February 11, 2016 bottom could be forming an Elliott five wave pattern. There was a smaller five wave structure from February to April 2016. The high of the subsequent corrective pattern exceeded the April peak — referred to as the orthodox top. In situations like this the supposed wave "one" is measured from the actual top, which is the June 8, 2016 high of 2120.60. The actual length of Minor wave "1" up from 1810.10 is 310.50. Occasionally wave "one" will be related to wave "5" by the Fibonacci ratio of .382, which 118.60 points. The supposed Minor wave "4" appears to have taken the form of a Horizontal Triangle. This structure has five overlapping sub waves with each sub wave subdividing into a three-wave pattern. The sub waves are labeled A-B-C-D-E. Moves after completion of Horizontal Triangles are measured from the end of wave "E". In this case wave "E" ended at the SPX 2335.10 bottom made on April 19, 2017. Adding 118.60 to 2335.10 targets SPX 2453.70 very close to the two larger Fibonacci coordinates. Three very close Fibonacci points represents power resistance. If one Fibonacci point represented a wooden wall, three Fibonacci points represent a steel wall. To break this wall would require a powerful upside move. One way or another May 2017 could turn out to be a very interesting month. |

|
| Figure 2. Adding 118.60 to 2335.10 targets SPX 2453.70, very close to the two larger Fibonacci coordinates. |
| Graphic provided by: BigCharts.com. |
| |
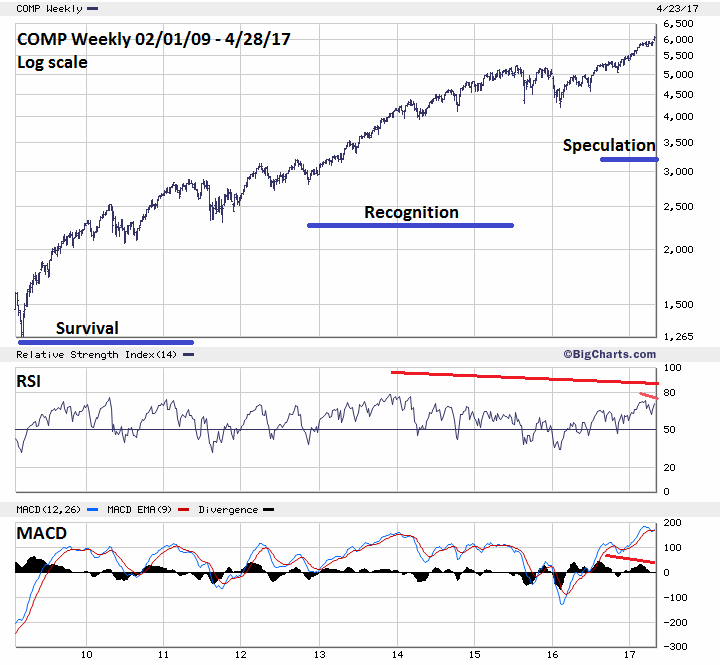
| Nasdaq Composite Long Term Please see the daily Nasdaq (COMP) chart illustrated in Figure 3. Of the three main US stock indices COMP is in the vanguard being the only index in April to make a new all-time high. This new COMP high registered double bearish divergences for both the weekly RSI and MACD Histogram. Internally there are also bearish divergence. COMP at 5417.40 on December 8, 2016 had 562 52-week highs. On February 21, 2017 at COMP 5866.00 there were 331 52-week highs. April 25th had 314 52-week highs at COMP 6025.50. The COMP high of 6074.00 on April 28th is close to a major Fibonacci coordinate. The COMP bear market from March 2000 to October 2002 was 4024.00 points x 1.236 = 4973.70 added to the October 2002 bottom of 1108.50 targets 6082.20. Also, illustrated on the COMP chart are the three phases of a bull market which was noted in my April 21st article, "Global Non-Conformation". |

|
| Figure 3. The COMP bear market from March 2000 to October 2002 was 4024.00 points x 1.236 = 4973.70 added to the October 2002 bottom of 1108.50 targets 6082.20. |
| Graphic provided by: BigCharts.com. |
| |
| Summary and Strategy May 2017 could see the final pieces of a giant jigsaw puzzle that began at the major bottom in March 2009 put in place. My April 12th article "Termination Date" noted May 1st and 8th as potential dates for the SPX to record a major top. The SPX closed April 28th at 2384.20. This makes May 8, 2017 the primary date for the SPX to reach the 2450-2460 bulls-eye price zone. Short 50% stocks if the SPX moves above 2420. Use SPX 2510 as a stop loss. We could know in just a few weeks if SPX 2450 is the right price for the bears to launch a major move down. Further Reading: Frost A.J and Robert Prechter (1985) "Elliott Wave Principle", New Classics Library. |
Independent investment advisor, trader and writer. He has written articles for Technical Analysis of Stocks & Commodities, Traders.com Advantage,Futuresmag.com and, Finance Magnates. Author of website Four Dimension Trading.
| Website: | www.fourdimensiontrading.com |
| E-mail address: | markrivest@gmail.com |
Click here for more information about our publications!
Comments

Request Information From Our Sponsors
- StockCharts.com, Inc.
- Candle Patterns
- Candlestick Charting Explained
- Intermarket Technical Analysis
- John Murphy on Chart Analysis
- John Murphy's Chart Pattern Recognition
- John Murphy's Market Message
- MurphyExplainsMarketAnalysis-Intermarket Analysis
- MurphyExplainsMarketAnalysis-Visual Analysis
- StockCharts.com
- Technical Analysis of the Financial Markets
- The Visual Investor
- VectorVest, Inc.
- Executive Premier Workshop
- One-Day Options Course
- OptionsPro
- Retirement Income Workshop
- Sure-Fire Trading Systems (VectorVest, Inc.)
- Trading as a Business Workshop
- VectorVest 7 EOD
- VectorVest 7 RealTime/IntraDay
- VectorVest AutoTester
- VectorVest Educational Services
- VectorVest OnLine
- VectorVest Options Analyzer
- VectorVest ProGraphics v6.0
- VectorVest ProTrader 7
- VectorVest RealTime Derby Tool
- VectorVest Simulator
- VectorVest Variator
- VectorVest Watchdog
