HOT TOPICS LIST
- MACD
- Fibonacci
- RSI
- Gann
- ADXR
- Stochastics
- Volume
- Triangles
- Futures
- Cycles
- Volatility
- ZIGZAG
- MESA
- Retracement
- Aroon
INDICATORS LIST
LIST OF TOPICS
PRINT THIS ARTICLE
by Mark Rivest
Techniques to find precise price targets in any market.
Position: N/A
Mark Rivest
Independent investment advisor, trader and writer. He has written articles for Technical Analysis of Stocks & Commodities, Traders.com Advantage,Futuresmag.com and, Finance Magnates. Author of website Four Dimension Trading.
PRINT THIS ARTICLE
FIBONACCI
Discovering Fibonacci Price Targets
03/15/17 04:29:25 PMby Mark Rivest
Techniques to find precise price targets in any market.
Position: N/A
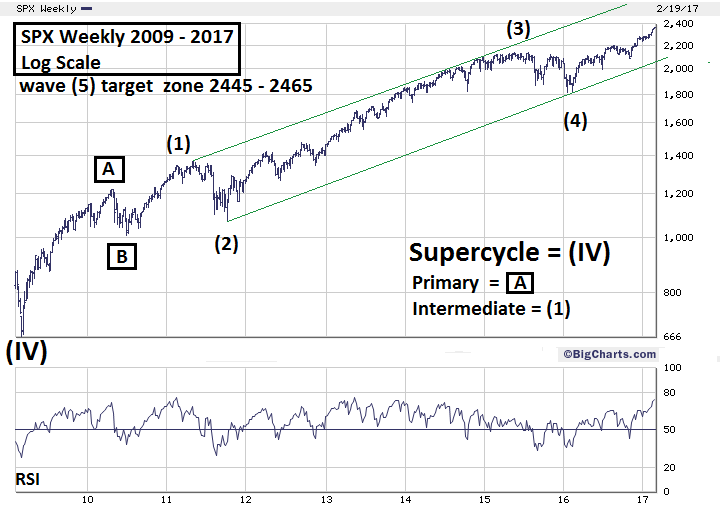
| The S&P 500 (SPX) could be on track to reach an important resistance zone at 2445-2465 by April or May 2017. If this price zone is reached and the SPX turns down, it could begin at least a 15-20% multi-month decline. The techniques to calculate this resistance zone can be used for any market or time scale. S&P 500 Weekly The first step in determining price targets is recognizing price patterns. The detailed rules and guidelines of the Elliott wave theory makes it an excellent methodology to find price patterns. Please see the weekly SPX chart illustrated in Figure 1. R.N. Elliott discovered that parallel trend channels usually mark the upper and lower boundaries of the most common wave pattern, called an Impulse. In this instance, because of the large percentage gains the SPX has made since 2009, log scale is required. From the bottom made in 2010, the SPX has the characteristics of a rising impulse wave. Within a five-wave impulse pattern, sub wave "One" is usually equal to sub wave "Five". Again, because of large percentage gains, the best way to measure intermediate wave(1) to wave(5) is to use logarithmic scale. Although sometimes in large moves arithmetic scale will work. Intermediate wave(1) which began in June 2010 at 1010.90 and completed in May 2011 was 359.70 points, or a percentage gain of 35.58%. From the February 11, 2016 bottom at 1810.10, a 35.58% gain targets SPX 2454.10. The next step would be finding if there's a secondary Fibonacci coordinate near the primary coordinate. The peak of intermediate wave(3) May 2015 peak at 2134.70 to the intermediate wave(4) bottom at 1810.10 is 324.60, multiplied by two equals 649.20 points, added to 1810.10 equals 2459.30 — amazingly close to the primary target of 2454.10. Fibonacci coordinates are like magnets drawing markets to them. Two or more coordinates nearby increases the power and reliability of the potential turn zones. |

|
| Figure 1. Fibonacci coordinates are like magnets drawing markets to them. |
| Graphic provided by: BigCharts.com. |
| |
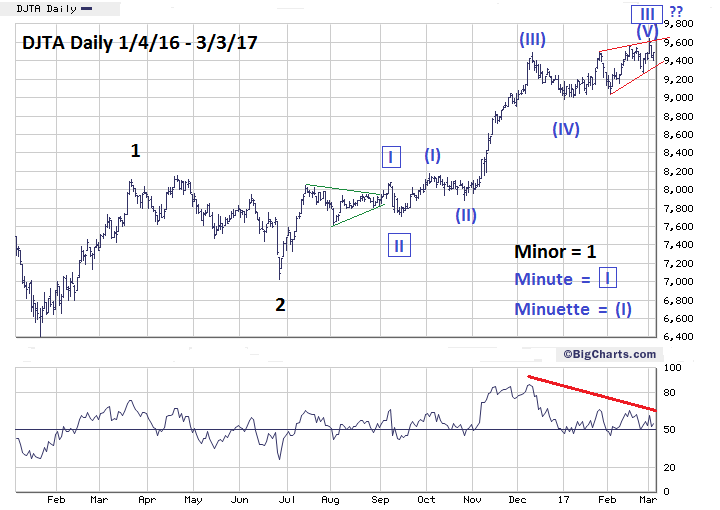
| Dow Jones Transportation Average Update Please see the Dow Jones Transportation Average (DJTA) chart illustrated in Figure 2. This is an update to the chart illustrated in my March 3rd article "Discovering Elliott Wave Patterns". If you are not trading or following US transportation stocks it is very important to follow the DJTA for at least the next three months. Why? Because this index has an exceptionally clear Elliott wave pattern. The DJTA since my last article has made a new all-time high and changed the wave structure. Previously it appeared the DJTA had completed minor wave "3" up from the early 2016 bottom. The new wave structure appears to have completed one wave degree lower with only minute wave "III" terminating. The March 3rd article speculated the DJTA could be further along in its impulse wave development than the SPX. The new DJTA wave structure puts that theory in doubt. The DJTA could be at the same stage of development as the SPX, or perhaps lagging. Regardless of where the DJTA is relative to the SPX, its exceptionally clear pattern makes it a very important index to watch. |

|
| Figure 2. This index has an exceptionally clear Elliott wave pattern. |
| Graphic provided by: BigCharts.com. |
| |
| Conclusion Fibonacci coordinates are like magnets drawing markets to them. If you discover two or more that are in a proximity this increases their power and reliability. The scale of the Fibonacci coordinates is directly related to the scale of the subsequent turn. If you use daily scale and the scope covers three months, the subsequent turn may only last a few weeks with perhaps a 2-4% price change. The two Fibonacci coordinates in the SPX 2450 area are derived from a wave structure that is from six years ago, more than a year for the other coordinate. If the SPX makes a peak in the 2450 area it implies a subsequent decline of 15-20% for at least several months. Comparing the SPX and DJTA bull markets since early 2016 to a football game, the indices would be entering the fourth quarter. The SPX, on March 1st, hit round number resistance in the 2400 area which could be a minor peak. If so, the subsequent decline could last about three or four weeks and bring the SPX to around 2280-2300. Seasonal factors imply a peak in April or May. Keep a close watch on momentum and sentiment indicators. Because of the clarity of its pattern, keep following the DJTA. Remember the truth is out there. Further reading: Frost A.J and Robert Prechter (1985) "Elliott Wave Principle", New Classics Library. |
Independent investment advisor, trader and writer. He has written articles for Technical Analysis of Stocks & Commodities, Traders.com Advantage,Futuresmag.com and, Finance Magnates. Author of website Four Dimension Trading.
| Website: | www.fourdimensiontrading.com |
| E-mail address: | markrivest@gmail.com |
Click here for more information about our publications!
Comments

|

Request Information From Our Sponsors
- StockCharts.com, Inc.
- Candle Patterns
- Candlestick Charting Explained
- Intermarket Technical Analysis
- John Murphy on Chart Analysis
- John Murphy's Chart Pattern Recognition
- John Murphy's Market Message
- MurphyExplainsMarketAnalysis-Intermarket Analysis
- MurphyExplainsMarketAnalysis-Visual Analysis
- StockCharts.com
- Technical Analysis of the Financial Markets
- The Visual Investor
- VectorVest, Inc.
- Executive Premier Workshop
- One-Day Options Course
- OptionsPro
- Retirement Income Workshop
- Sure-Fire Trading Systems (VectorVest, Inc.)
- Trading as a Business Workshop
- VectorVest 7 EOD
- VectorVest 7 RealTime/IntraDay
- VectorVest AutoTester
- VectorVest Educational Services
- VectorVest OnLine
- VectorVest Options Analyzer
- VectorVest ProGraphics v6.0
- VectorVest ProTrader 7
- VectorVest RealTime Derby Tool
- VectorVest Simulator
- VectorVest Variator
- VectorVest Watchdog
