HOT TOPICS LIST
- MACD
- Fibonacci
- RSI
- Gann
- ADXR
- Stochastics
- Volume
- Triangles
- Futures
- Cycles
- Volatility
- ZIGZAG
- MESA
- Retracement
- Aroon
INDICATORS LIST
LIST OF TOPICS
PRINT THIS ARTICLE
by Mark Rivest
Here are some techniques to differentiate between patterns and forecast market turns.
Position: N/A
Mark Rivest
Independent investment advisor, trader and writer. He has written articles for Technical Analysis of Stocks & Commodities, Traders.com Advantage,Futuresmag.com and, Finance Magnates. Author of website Four Dimension Trading.
PRINT THIS ARTICLE
ELLIOTT WAVE
Discovering Elliott Wave Patterns
03/03/17 05:20:12 PMby Mark Rivest
Here are some techniques to differentiate between patterns and forecast market turns.
Position: N/A
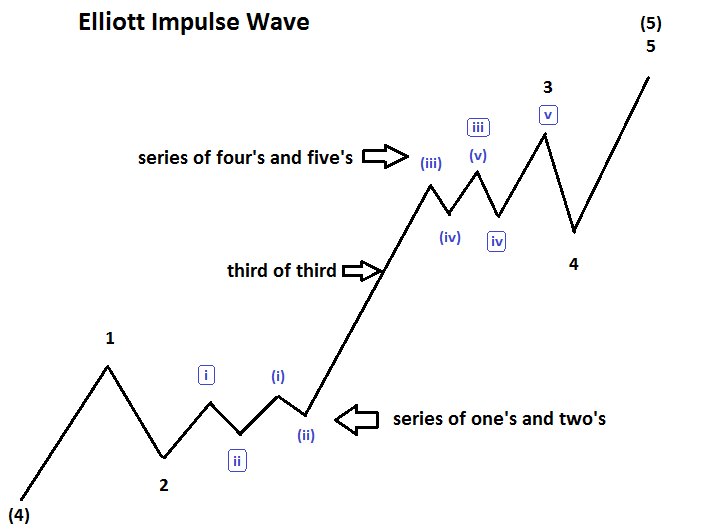
| There are thirteen different Elliott wave patterns, sometimes it's difficult to determine which pattern is in effect. Since August 2016 the S&P 500 (SPX) has had several examples where simple techniques could be used to determine the correct wave count. This article will review some of those techniques and examine clues to the coming path for US stock indices. Elliott Wave Patterns There are two classes of Elliott waves; Motive and Corrective. Motive waves subdivide into "five" waves and always move in the same direction as the trend of one larger degree. Within the Motive wave class there are two families; Impulse and Diagonal. Corrective waves correct the progress of Motive waves. Please see the Elliott wave Impulse chart illustrated in Figure 1. Impulse waves are the most common Motive waves, and in the stock market the third wave of the impulse is usually the longest. Extensions occur in the longest wave; this is where you can clearly see the sub divisions of the next lower degree wave. In a rising market the extension begins with one base followed by another base. It's like the market is building up strength for the subsequent blast, referred to as a third of a third. After a dynamic relentless move up the market goes into a choppy period, then completes the extension with a move up to a new high. |

|
| Figure 1. Extensions occur in the longest wave. This is where you can clearly see the sub divisions of the next lower degree wave. |
| Graphic provided by: Mark Rivest. |
| |
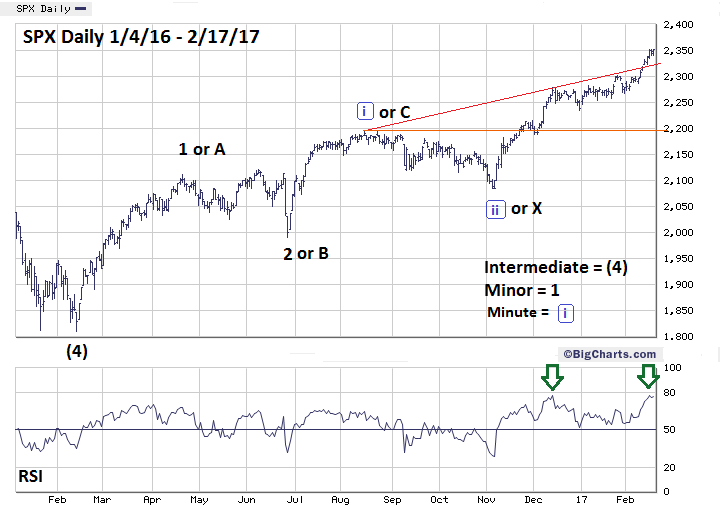
| S&P 500 There are four market dimensions: Price, Time, Momentum, and Sentiment. The best way to determine Elliott wave patterns is to examine the weight of evidence from all four dimensions. Please see the daily SPX chart illustrated in Figure 2. My August 29th article "Stock Market Lessons from Mr. Fibonacci" noted a Fibonacci price relationship indicating potential resistance at SPX 2183.53 and a fascinating Fibonacci time relationship targeting August 15th as a potential top. My November 8th article "Too Close to Call" focused on Time and Momentum dimensions, noting- the seasonal time clock was running out for the bears. Momentum as recorded by the daily Slow Stochastic and RSI had reached the oversold zone. My December 20th article "Stock Market Bears Hold the One Yard Line" speculated that the SPX had completed an Ending Diagonal Triangle (EDT) and that SPX 2285.92 was important resistance. Evidence from sentiment and momentum supported the wave count as both dimensions were bearish. Subsequently, the SPX broke above 2285.92, eliminating the EDT wave count. My February 17th article "Tools to Find Market Turns - Part Two" speculated that an even larger SPX EDT was forming from the February 11, 2016 bottom. A rising daily trend line combined with precise Fibonacci price and time ratios gave powerful evidence that the third wave of this structure was complete. Bearish evidence from sentiment and momentum supported the EDT wave count. Subsequently the SPX has moved significantly above the rising trend line. While the EDT wave count could still be in effect, almost all EDT's form a narrowing wedge, the SPX would have to reach at least 2193.81 in only one week. A very low probability. Critics could point to the instances of the SPX breaking above 2285.92 and the trend line break on February 13th as evidence that technical analysis doesn't work. Nothing could be further from the truth. Having a correct forecast is great, it's also important to quickly know when the forecast is wrong. Elliott wave theory instantly signaled the EDT forecast was wrong on a move above 2285.92 and the move above the rising trend line has quickly indicated that the recent EDT forecast could be wrong. |

|
| Figure 2. The best way to determine Elliott wave patterns is to examine the weight of evidence from all four dimensions. |
| Graphic provided by: BigCharts.com. |
| |
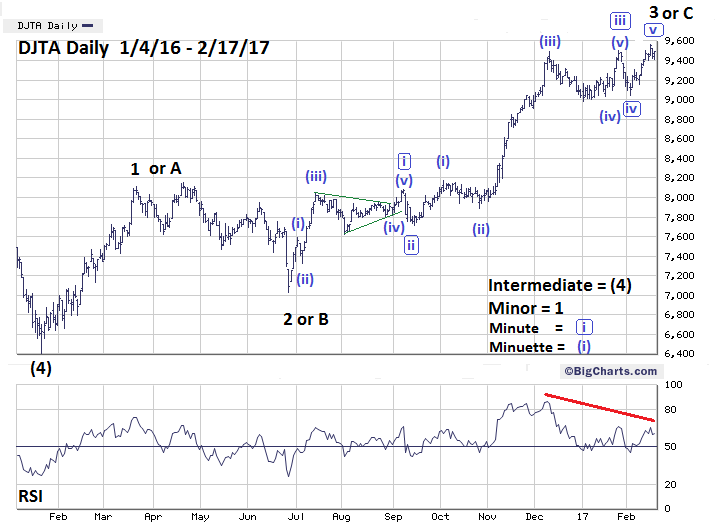
| Dow Jones Transportation Average The tag line for the television series "The X-Files" was "The truth is out there". The same can be said when using Elliott wave theory. One aspect about using the theory with the stock market is, if the pattern is unclear in say an index, you may find another index or stock that has a clearer pattern. Please see the daily Dow Jones Transportation Average (DJTA) chart illustrated in Figure 3. Whiel the SPX wave count from the November 4th bottom is unclear, the DJTA has an exceptionally clear pattern of a text book Impulse wave under development. If the supposed Minor wave "3" is complete we can expect a decline in the next few weeks to perhaps 8800-9000. This decline could set the stage for the final rally to above the recent high at 9566.10. It appears that the DJTA is further along in its Impulse wave development than the SPX. If so, and if the bull market continues, the DJTA could hit its final peak days or even weeks before the SPX reaches completion of its supposed Impulse wave up from early 2016. The clarity and possible advanced development makes the DJTA the most important stock index to watch. |

|
| Figure 3. The clarity and possible advanced development makes the DJTA the most important stock index to watch. |
| Graphic provided by: BigCharts.com. |
| |
| Summary and Strategy The markets trade in four dimensions: Price, Time, Sentiment, and Momentum. Use evidence from all four to support whatever price pattern recognition method you are using. Expand your horizon if you're using Elliott on stocks markets. View indices, ETF's and individual stocks to discover the clearest pattern. My February 17th article recommended going long 25% if the SPX reached 2193.81 to 2170.00. Cancel this recommendation. It's very doubtful the SPX could reach this zone in time to remain a valid EDT formation. One final point — The US stock market during the last six months has seen three instances in which momentum has weakened with little or no downside movement in price. At the same time, sentiment has grown increasingly bullish. This could be the prelude to a major top forming. If so, the process could take a few more months. Until then watch the indicators, watch the DJTA. And remember, the truth is out there. Further Reading: Frost A.J and Robert Prechter (1985) "Elliott Wave Principle", New Classics Library. |
Independent investment advisor, trader and writer. He has written articles for Technical Analysis of Stocks & Commodities, Traders.com Advantage,Futuresmag.com and, Finance Magnates. Author of website Four Dimension Trading.
| Website: | www.fourdimensiontrading.com |
| E-mail address: | markrivest@gmail.com |
Click here for more information about our publications!
PRINT THIS ARTICLE

|

Request Information From Our Sponsors
- StockCharts.com, Inc.
- Candle Patterns
- Candlestick Charting Explained
- Intermarket Technical Analysis
- John Murphy on Chart Analysis
- John Murphy's Chart Pattern Recognition
- John Murphy's Market Message
- MurphyExplainsMarketAnalysis-Intermarket Analysis
- MurphyExplainsMarketAnalysis-Visual Analysis
- StockCharts.com
- Technical Analysis of the Financial Markets
- The Visual Investor
- VectorVest, Inc.
- Executive Premier Workshop
- One-Day Options Course
- OptionsPro
- Retirement Income Workshop
- Sure-Fire Trading Systems (VectorVest, Inc.)
- Trading as a Business Workshop
- VectorVest 7 EOD
- VectorVest 7 RealTime/IntraDay
- VectorVest AutoTester
- VectorVest Educational Services
- VectorVest OnLine
- VectorVest Options Analyzer
- VectorVest ProGraphics v6.0
- VectorVest ProTrader 7
- VectorVest RealTime Derby Tool
- VectorVest Simulator
- VectorVest Variator
- VectorVest Watchdog
