

HOT TOPICS LIST
- MACD
- Fibonacci
- RSI
- Gann
- ADXR
- Stochastics
- Volume
- Triangles
- Futures
- Cycles
- Volatility
- ZIGZAG
- MESA
- Retracement
- Aroon
INDICATORS LIST
LIST OF TOPICS
PRINT THIS ARTICLE
by Mark Rivest
The S&P 500 reaches resistance, see why it could hold and where it can go next.
Position: N/A
Mark Rivest
Independent investment advisor, trader and writer. He has written articles for Technical Analysis of Stocks & Commodities, Traders.com Advantage,Futuresmag.com and, Finance Magnates. Author of website Four Dimension Trading.
PRINT THIS ARTICLE
SUPPORT & RESISTANCE
Tools to Find Market Turns - Part Two
02/17/17 01:08:13 PMby Mark Rivest
The S&P 500 reaches resistance, see why it could hold and where it can go next.
Position: N/A
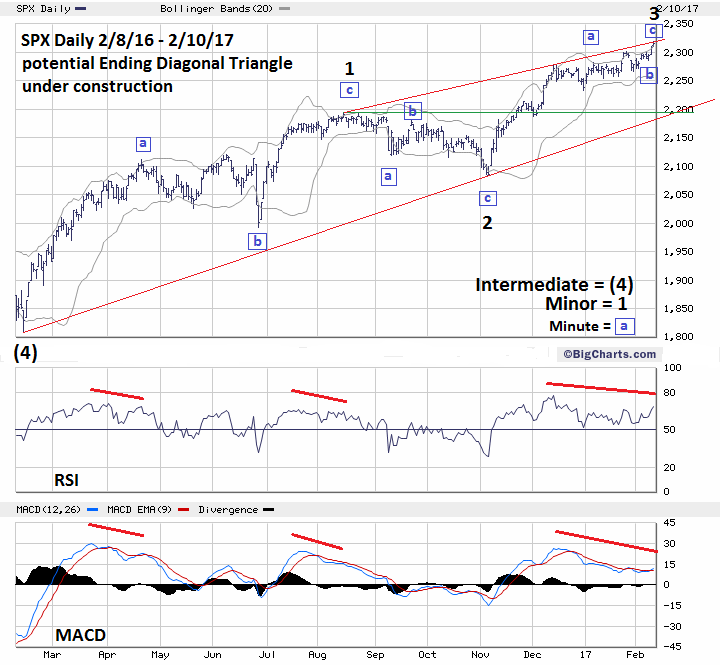
| My February 10th article "The Tools to Find Market Turns" focused on how to use Bollinger Bands and trend lines to discover market tops and bottoms. Subsequently the S&P 500 (SPX) has reached a trend line connecting the August and December peaks. The overwhelming weight of technical evidence indicates this resistance could hold and a sharp decline could be imminent. Daily S&P 500 My February 10th article noted the two types of Bollinger Band breaks, shallow angle and sharp angle. Steep angle breaks are more common and can lead to four to eight successive bars outside the Bollinger Band. On February 9-10 the SPX had a steep angle break of the Bollinger Band and is potentially bullish, however it's offset by a huge amount of bearish evidence starting with the daily trend line. Please see the daily SPX chart illustrated in Figure 1. My February 10th article noted a trend line connecting the SPX December to January peaks as possible resistance. Subsequently, the SPX has pushed above this line and has reached the larger trend line connecting the August and December peaks. This is potentially bearish and backed up by a considerable amount of evidence. My July 21st article "How to Trade Defensively" noted the possibility that the SPX rally from February 11, 2016 could be taking the form of an Elliott wave Ending Diagonal Triangle (EDT). For several months, evidence continued to build suggesting that indeed an EDT was forming. From late 2016 to very early in 2017 it appeared the EDT was complete, or close to completion, until January 25th when the SPX broke above very important Elliott wave resistance at SPX 2285.92. On February 10th, the SPX reached 2319.23 giving us an important clue that brings back the possibility that an EDT from the February 11, 2016 bottom is still under construction. Every Elliott wave pattern will usually have Fibonacci price and time relationships between segments of the patterns. The supposed Minor wave "1" from February 11 to August 15 was 383.71 SPX points. The supposed Minor wave "3" from November 4 to February 10 was 235.44 SPX points. 235.44/393.71 = .613 a near perfect Fibonacci golden ratio of .618, and a typical price relationship between waves "one" and "three" of an EDT. The February to August rally was 187 calendar days. The November to February rally was 99 calendar days. 99/187 = .529 very close to a Fibonacci .50 ratio and a typical time relationship between waves "one" and "three of an EDT. Additionally, the SPX percentage gain from February to August is 21.19%. The SPX percentage gain from November to February is 11.29%. 11.29/21.19 = .532, almost the same as the time ratio of .529. Amazing! |
|
| Figure 1. The February to August rally was 187 calendar days. The November to February rally was 99 calendar days. 99/187 = .529, very close to a Fibonacci .50 ratio. |
| Graphic provided by: BigCharts.com. |
| |
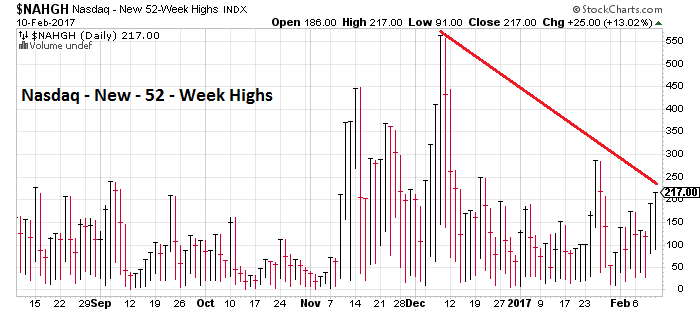
| Momentum Dimension Weakening momentum both externally and internally is a characteristic of a developing EDT. The SPX daily RSI and MACD illustrate the external momentum weakness. Note on the daily SPX chart that both RSI and MACD are showing similar bearish divergences as those at the April and August peaks. At both prior peaks the subsequent declines were in the range of 5 to 6%. If an EDT is forming and Minor wave "3" is complete as of the February 10th top, we can expect the same range for the next decline. Please see Nasdaq - New 52-Week Highs chart illustrated in Figure 2. Since August, the Nasdaq Composite has been the strongest US stock Index, yet its internal momentum is weaker than the NYSE. As of February 10th, there is a double bearish divergence vs. the powerful early December surge, clear evidence that at least a pause in the rally is imminent. |
|
| Figure 2. As of February 10th, there is a double bearish divergence vs. the powerful early December surge, clear evidence that at least a pause in the rally is imminent. |
| Graphic provided by: StockCharts.com. |
| |
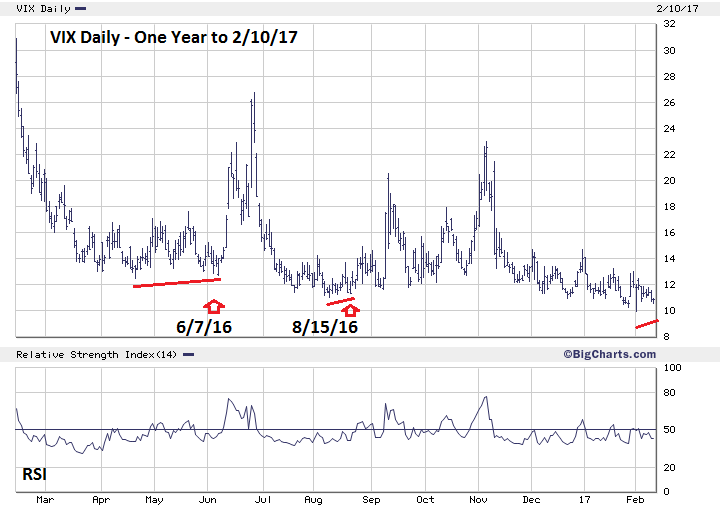
| Sentiment and Time Dimensions Please see the Daily VIX chart illustrated in Figure 3. As noted in several of my articles, the VIX almost always has a divergence when the SPX makes a top. Note that on February 10th the VIX had a divergence vs. its February 1st bottom. Note the similar occurrences in June and August which were SPX tops. The Market Vane Bullish Consensus most recent weekly reading for US stock futures is 66%, matching the two-year high reading made in mid-December. Usually readings over 60% are an indication that at least an intermediate peak is near. So far there are thirteen consecutive weekly readings over 60%. This situation could continue for several more weeks and may be a sign of a developing major top. In the time dimension, there's been a return of the lunar cycle. Occasionally markets will turn on full or new moons. The December 13th full moon was a minor SPX top. The January 12th full moon marked a minor SPX bottom. The January 26th minor top was one trading day before a new moon. February 10, 2017 was a full moon. |
|
| Figure 3. VIX almost always has a divergence when the SPX makes a top. |
| Graphic provided by: BigCharts.com. |
| |
| Summary, Forecast and Strategy The SPX hitting a multi-month trend line with precise Fibonacci price and time relationships accompanied by bearish momentum and a VIX sell signal is very powerful evidence at least a minor peak could be in place. If an EDT is under construction, there's a very narrow price and time zone for the SPX to reach the Minor wave "4" bottom. A good analogy would be landing a Jet on an aircraft carrier. EDT wave "four" almost always crosses over into the territory of wave "one" which in this case is the SPX peak on August 15th at 2193.81. EDT's almost always form a narrowing wedge. Because of these two factors the SPX price target is approximately 2193.81 to 2170. Note on the daily SPX chart the trend line connecting the EDT point of origin February 11, 2016 with the November 4th bottom intersects with the minimum price target of 2193.81 at about February 24th. There's a new moon on Sunday, February 26th, so February 27th is also a target date. Using a shallower rising trendline that connects only Minor wave "2" with the future Minor "4" could stretch the time target out to mid-March. The scenario will be discussed in a future article if necessary. If the SPX reaches 2193.81 to 2170.00, go long 25% with a stop loss at SPX 2083.78. Further Reading: Frost A.J and Robert Prechter (1985) "Elliott Wave Principle", New Classics Library. Hadady R. Earl (1983) "Contrary Opinion", Key Books. |
Independent investment advisor, trader and writer. He has written articles for Technical Analysis of Stocks & Commodities, Traders.com Advantage,Futuresmag.com and, Finance Magnates. Author of website Four Dimension Trading.
| Website: | www.fourdimensiontrading.com |
| E-mail address: | markrivest@gmail.com |
Click here for more information about our publications!
PRINT THIS ARTICLE

Request Information From Our Sponsors
- StockCharts.com, Inc.
- Candle Patterns
- Candlestick Charting Explained
- Intermarket Technical Analysis
- John Murphy on Chart Analysis
- John Murphy's Chart Pattern Recognition
- John Murphy's Market Message
- MurphyExplainsMarketAnalysis-Intermarket Analysis
- MurphyExplainsMarketAnalysis-Visual Analysis
- StockCharts.com
- Technical Analysis of the Financial Markets
- The Visual Investor
- VectorVest, Inc.
- Executive Premier Workshop
- One-Day Options Course
- OptionsPro
- Retirement Income Workshop
- Sure-Fire Trading Systems (VectorVest, Inc.)
- Trading as a Business Workshop
- VectorVest 7 EOD
- VectorVest 7 RealTime/IntraDay
- VectorVest AutoTester
- VectorVest Educational Services
- VectorVest OnLine
- VectorVest Options Analyzer
- VectorVest ProGraphics v6.0
- VectorVest ProTrader 7
- VectorVest RealTime Derby Tool
- VectorVest Simulator
- VectorVest Variator
- VectorVest Watchdog