

HOT TOPICS LIST
- MACD
- Fibonacci
- RSI
- Gann
- ADXR
- Stochastics
- Volume
- Triangles
- Futures
- Cycles
- Volatility
- ZIGZAG
- MESA
- Retracement
- Aroon
INDICATORS LIST
LIST OF TOPICS
PRINT THIS ARTICLE
by Mark Rivest
See how to use Bollinger Bands and trend lines to discover market tops and bottoms.
Position: N/A
Mark Rivest
Independent investment advisor, trader and writer. He has written articles for Technical Analysis of Stocks & Commodities, Traders.com Advantage,Futuresmag.com and, Finance Magnates. Author of website Four Dimension Trading.
PRINT THIS ARTICLE
SUPPORT & RESISTANCE
The Tools to Find Market Turns
02/10/17 02:09:21 PMby Mark Rivest
See how to use Bollinger Bands and trend lines to discover market tops and bottoms.
Position: N/A
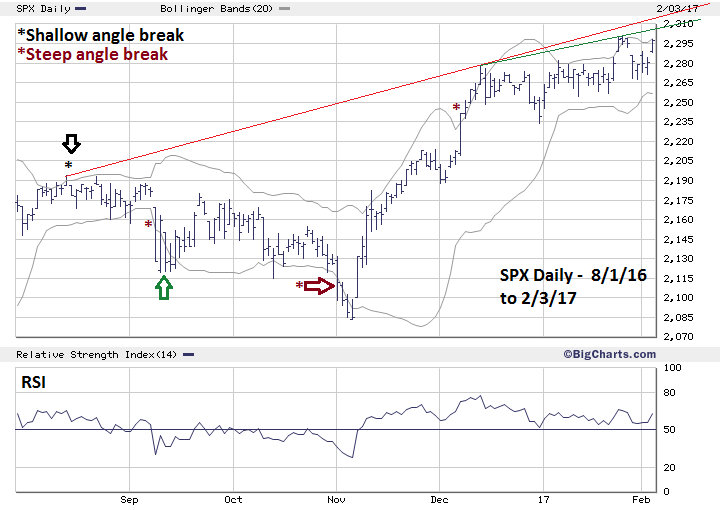
| The easiest way to maximize trading profits is by catching market turns. What's not easy is knowing when a market is turning. Utilizing a combination of tools will increase your probabilities for success. Bollinger Bands And Trend Lines My February 3rd article "Stock Market Breaks Through Resistance" noted several paths that the S&P 500 (SPX) could travel after the decisive break above 2285.92. The two most bullish were: 1) If the SPX can decisively break above 2310 it will open the door for a steady relentless rally up to at least 2400. 2) If the SPX fails to exceed 2310 it could be the start of a one to two week decline to the 2233 area. If this situation occurs, it would probably be another wave "two" down — only a pause before a steady relentless rally begins. After the SPX January 26th top at 2300.99 there was a shallow decline to only 2267.32. It appears the bulls are still in control and the next rally is now underway, but what if something else is happening? Bollinger Bands and trend lines could provide very important clues for the week of February 6-10. Please see the SPX daily chart illustrated in Figure 1. Market tops or bottoms can be discovered when price moves outside the Bollinger Bands. The key points to watch are price bar size and angle of the break. Note in August prior to the upside break the upper Bollinger Band was rising at a shallow angle. At the August 15th top the price bar was small. The next price bar closed below the Bollinger Band confirming a trend change. This is the ideal Bollinger Band turn signal and it doesn't happen very often. When using daily price data this type of signal may occur only two or three times a year. Sometimes, two successive bars could be outside the band, if the second bar matches or only marginally exceeds the first bar it can be turn signal. Confirmation would occur with the third price bar moving within the boundary of the band. A far more common break comes on a steep angle which starts with a large price bar that decisively turns the Bollinger Band. I call this a "gate opener" and can lead to four to eight successive bars outside the Bollinger Bands — not something you want to trade against. Note the break in September 2016 and that the third bar of the break failed to make downside progress. This doesn't happen very often and is a sign the break out is exhausted. Usually after multiple successive bars outside the band a trend change can be signaled by moving back within the boundary of the band. If this happens there's no guarantee of a trend change. Note the mid-November upside break followed by a move back into the boundary of the band, then a subsequent two-week rally below the upper band. Use the extreme point of the last bar outside the band as a stop loss. Using trend lines can occasionally aid in confirming a potential Bollinger Band trend signal. Please note the rising trendlines from the August, December and, January peaks. |
|
| Figure 1. Market tops or bottoms can be discovered when price moves outside the Bollinger Bands. |
| Graphic provided by: BigCharts.com. |
| |
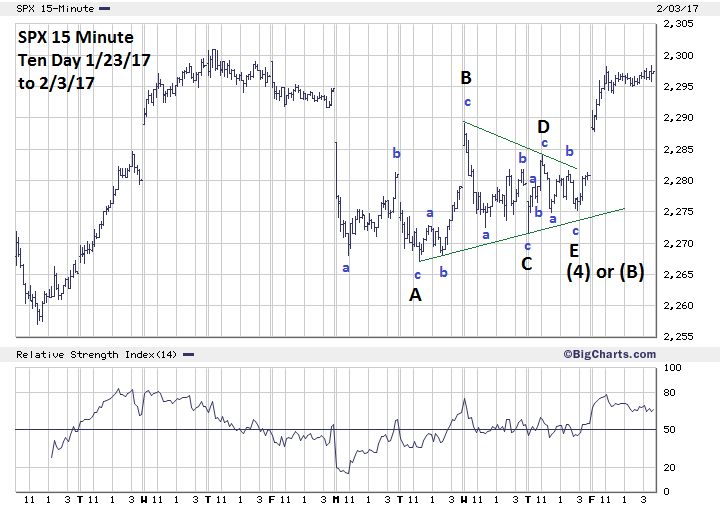
| S&P 500 Intraday Please see the SPX 15 Minute - Ten Day chart illustrated in Figure 2. The SPX subsequent move down from the January 26th top at 2300.99 appears to be a near text book Elliott wave Horizontal Triangle. The powerful rally off the bottom made at SPX 2275.16 labeled as wave "E" of "(4)" is called a post triangle thrust and is expected after completion of a Horizontal Triangle. There's a very high probability that a Horizontal Triangle completed on February 2nd. Why is this important? A Horizontal Triangle always occurs in a position prior to the final wave in the pattern of one larger degree, which in this case is up. Again, my February 3rd article noted that the SPX failing to exceed 2310 could lead to a one to two week decline and the decline would probably be another wave "two" down. Horizontal Triangles don't appear as wave "two". They only occur in waves "four" or "B". This strongly implies that the rally from February 2nd could be short lived. Typically, the length of a post triangle trust is measured from the widest length of the triangle added to end of the triangle — wave "E". The decline from January 26th to January 31st was 33.78 SPX points added to the February 2nd bottom at 2275.16 targets 2308.94 as a potential top. |
|
| Figure 2. The SPX subsequent move down from the January 26th top at 2300.99 appears to be a near text book Elliott wave Horizontal Triangle. |
| Graphic provided by: BigCharts.com. |
| |
| Summary and Strategy On February 3rd, the daily SPX price bar was just below the upper Bollinger Band. If from February 6-8 the SPX moves above the January 26th high of 2300.99, then the upper daily Bollinger Band there could be a top. The trendline connecting the SPX December and January peaks crosses 2305-2308 during February 6-8. The price target for the supposed Horizontal Triangle measured from wave "E" is at 2308.94. Combining all three of these factors gives us a target area for a top at 2203-2210. If the SPX decisively moves above the August-December trend line and crosses 2214-2217 during February 6-8, it could be a signal that a relentless rally into at least mid- March is underway. If trading the long side, limit exposure to 25%. As noted in my February 3rd article a major sell point is at SPX 2083, which was the November 4th bottom. Even if the SPX doesn't reach this intermediate low, the SPX is still vulnerable to a short-term decline that could be as large as 9%. Further Reading: Frost A.J and Robert Prechter (1985) "Elliott Wave Principle", New Classics Library. |
Independent investment advisor, trader and writer. He has written articles for Technical Analysis of Stocks & Commodities, Traders.com Advantage,Futuresmag.com and, Finance Magnates. Author of website Four Dimension Trading.
| Website: | www.fourdimensiontrading.com |
| E-mail address: | markrivest@gmail.com |
Click here for more information about our publications!
Comments
Date:�02/11/17Rank:�4Comment:�Good article! only see below
If the SPX decisively moves above the August-December trend line and crosses 2214-2217 during February 6-8, it could be a signal that a relentless rally into at least mid- March is underway
2214 - 2217 must be 2314 -2317 ?
Thanks for share it
Date:�02/16/17Rank:�1Comment:�Why are you always trying to pick tops. We are up about 100 S P points since you were shorting the market in late December. The market may correct sooner or later. We won t have a major correction as long as new highs are 200+ every day.
Date:�11/16/19Rank:�5Comment:�

Request Information From Our Sponsors
- StockCharts.com, Inc.
- Candle Patterns
- Candlestick Charting Explained
- Intermarket Technical Analysis
- John Murphy on Chart Analysis
- John Murphy's Chart Pattern Recognition
- John Murphy's Market Message
- MurphyExplainsMarketAnalysis-Intermarket Analysis
- MurphyExplainsMarketAnalysis-Visual Analysis
- StockCharts.com
- Technical Analysis of the Financial Markets
- The Visual Investor
- VectorVest, Inc.
- Executive Premier Workshop
- One-Day Options Course
- OptionsPro
- Retirement Income Workshop
- Sure-Fire Trading Systems (VectorVest, Inc.)
- Trading as a Business Workshop
- VectorVest 7 EOD
- VectorVest 7 RealTime/IntraDay
- VectorVest AutoTester
- VectorVest Educational Services
- VectorVest OnLine
- VectorVest Options Analyzer
- VectorVest ProGraphics v6.0
- VectorVest ProTrader 7
- VectorVest RealTime Derby Tool
- VectorVest Simulator
- VectorVest Variator
- VectorVest Watchdog