

HOT TOPICS LIST
- MACD
- Fibonacci
- RSI
- Gann
- ADXR
- Stochastics
- Volume
- Triangles
- Futures
- Cycles
- Volatility
- ZIGZAG
- MESA
- Retracement
- Aroon
INDICATORS LIST
LIST OF TOPICS
PRINT THIS ARTICLE
by Mark Rivest
How long can the rally last, and where are the next resistance areas?
Position: N/A
Mark Rivest
Independent investment advisor, trader and writer. He has written articles for Technical Analysis of Stocks & Commodities, Traders.com Advantage,Futuresmag.com and, Finance Magnates. Author of website Four Dimension Trading.
PRINT THIS ARTICLE
ELLIOTT WAVE
Stock Market Breaks Through Resistance
02/03/17 04:04:18 PMby Mark Rivest
How long can the rally last, and where are the next resistance areas?
Position: N/A
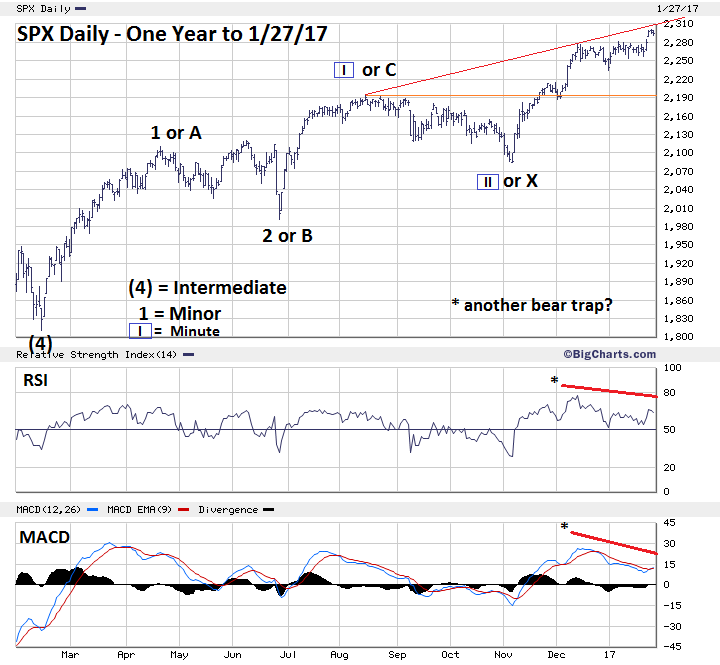
| Since December 9, 2016 the S&P 500 (SPX) had traded in a narrow price range just below a very important Fibonacci resistance point at 2285.92. On January 25, 2017, this resistance was decisively broken, opening the door for what could be a powerful rally lasting to at least April. The week of January 30-February 3 could reveal important clues of bullish strength. Elliott Wave Patterns The move above SPX 2285.92 changed the dynamics of the Elliott wave price structure. Please see the daily SPX - One Year chart illustrated in Figure 1. Prior to January 25th the best SPX Elliott wave count from the February 11, 2016 bottom was an Ending Diagonal Triangle (EDT). This structure subdivides into five waves and moves in the same direction as the trend of one larger degree. The third wave within this pattern can never be the shortest. The first wave of the supposed EDT from February 11th ended June 8th at 2120.56 — 310.46 points. June 27-August 15 was the supposed third wave — 202.13 points. The supposed wave four bottom was on November 4th at 2083.79, adding 202.13 targets 2085.92 as the maximum point for wave five. There is no leeway with violations of Elliott wave rules, one tick beyond the maximum level eliminates the supposed wave count and opens the door to other patterns. In this situation, most of the patterns are bullish. Figure 1 shows two possible patterns, the most bullish is referred to as a series of ones and twos and was illustrated in my December 14th article "Bull Run". In rising markets, after the second wave "two" down a market will then enter a relentless steady rally with only tiny pullbacks. This third of a third up is the center and usually the most dynamic part of a five-wave structure. Note the bearish RSI and MACD divergences. This could be a repeat of what's happened in the last several months when bearish momentum divergences only trigger minor declines, then a new rally begins. In this case, the minor decline of January 26-27 could be complete, with the relentless rally continuing for several weeks. The other illustrated wave count is a possible Double Zigzag forming from the February 11th bottom. In this situation, the second wave "A" up could be nearing completion and may peak at, or near, the rising trend line at 2310. If this occurs, we could expect another multi-week decline retracing anywhere from 30% to 99.99% of the rally from November 4th at 2083.79. Not illustrated is a bearish wave count in which a Double Zigzag up from February 11th is complete, or close to completion. In this situation, the first "A-B-C" Zigzag was February-June with the June 27th bottom as "X" wave followed by a second wave "A" up to August 15th and a second wave "B" down to November 4th. We won't know if this count is correct unless the bottom at 2083.79 is breeched. Finally, there is a fascinating wave count in which a larger Ending Diagonal Triangle could be under construction. It's too early to get into detail on this potential count, it will be examined later if more evidence develops. |
|
| Figure 1. In rising markets, after the second wave �two� down, a market will then enter a relentless, steady rally with only tiny pullbacks. |
| Graphic provided by: BigCharts.com. |
| |
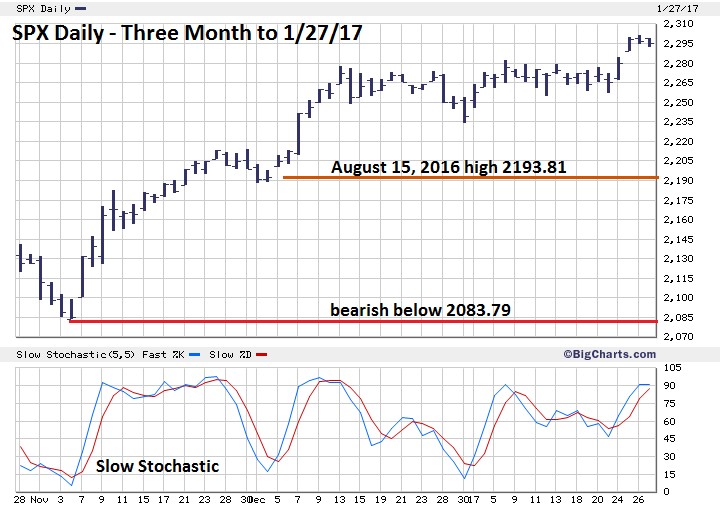
| Important Price Levels The week of January 30th to February 3rd could provide clues as to the near-term direction of stocks in February. Please see the daily SPX - Three Month chart illustrated in Figure 2. If the SPX can decisively break above 2310 it will open the door for a steady relentless rally up to at least 2400. If the SPX fails to exceed 2310 it could be the start of a one-two week decline to the 2233 area. If this situation occurs, it would probably be another wave "two" down — only a pause before a steady relentless rally begins. A decline below the 2233 area would imply that wave "B" down of the second Zigzag is underway. The decline could last several weeks. Moving down to 2193.81 could bring the supposed larger EDT count into play. Moving below 2083.79 would open the door to much lower prices and imply a major top was in place. |
|
| Figure 2. If the SPX fails to exceed 2310 it could be the start of a one�two week decline to the 2233 area. |
| Graphic provided by: BigCharts.com. |
| |
| Time and Sentiment Dimensions Time Dimension: My December 28th article, "Trading the Cusp of a New Year", illustrated several examples of stock market turns coming on the last or first trading day of the year. Occasionally turns have come shortly after the start of the new year. A major top for the Dow Jones Industrial Average was on January 11, 1973. The high so far has been made on January 26th which is outside the narrow time frame for an early year turn. This implies broader seasonal factors are in effect. If so, we can expect the stock market to make new highs until at least early April. Sentiment Dimension: Several of my articles have noted that the VIX almost always needs to have a divergence for the SPX to make a top. On January 27th VIX made a new low at 10.30. Not only is this the lowest level in 52 weeks, it's also below the 10.88 reading made in August 2015 prior to the mini-crash. There is a very high probability the SPX will continue to rally until the VIX can register at least one divergence. |
| Summary and Strategy Low probability does not mean no probability. For several weeks, the US stock market has had bearish momentum, while sentiment readings were at levels normally associated with at least intermediate tops. Most of the time this combination is toxic for any bull market, but the bulls have gotten their second wind. With a major sell point at 2083, over 9% below current levels, keep exposure to longs at 25%. Seasonal factors imply stocks could rally into at least early April, perhaps after February 3 the wave structure will provide clues for a more definitive resistance area. For now, watch for what could be a small pull-back to initiate limited long positions. Major stock market tops sometimes may take many months to develop. Late July 2016 may have just been the beginning of a multi-month topping process with several months of rising prices still ahead. Further Reading: Frost A.J and Robert Prechter (1985) "Elliott Wave Principle", New Classics Library. |
Independent investment advisor, trader and writer. He has written articles for Technical Analysis of Stocks & Commodities, Traders.com Advantage,Futuresmag.com and, Finance Magnates. Author of website Four Dimension Trading.
| Website: | www.fourdimensiontrading.com |
| E-mail address: | markrivest@gmail.com |
Click here for more information about our publications!
Comments

Request Information From Our Sponsors
- VectorVest, Inc.
- Executive Premier Workshop
- One-Day Options Course
- OptionsPro
- Retirement Income Workshop
- Sure-Fire Trading Systems (VectorVest, Inc.)
- Trading as a Business Workshop
- VectorVest 7 EOD
- VectorVest 7 RealTime/IntraDay
- VectorVest AutoTester
- VectorVest Educational Services
- VectorVest OnLine
- VectorVest Options Analyzer
- VectorVest ProGraphics v6.0
- VectorVest ProTrader 7
- VectorVest RealTime Derby Tool
- VectorVest Simulator
- VectorVest Variator
- VectorVest Watchdog
- StockCharts.com, Inc.
- Candle Patterns
- Candlestick Charting Explained
- Intermarket Technical Analysis
- John Murphy on Chart Analysis
- John Murphy's Chart Pattern Recognition
- John Murphy's Market Message
- MurphyExplainsMarketAnalysis-Intermarket Analysis
- MurphyExplainsMarketAnalysis-Visual Analysis
- StockCharts.com
- Technical Analysis of the Financial Markets
- The Visual Investor