

HOT TOPICS LIST
- MACD
- Fibonacci
- RSI
- Gann
- ADXR
- Stochastics
- Volume
- Triangles
- Futures
- Cycles
- Volatility
- ZIGZAG
- MESA
- Retracement
- Aroon
INDICATORS LIST
LIST OF TOPICS
PRINT THIS ARTICLE
by Mark Rivest
Looking to profit from the new year? Learn what opportunities 2017 offers.
Position: Sell
Mark Rivest
Independent investment advisor, trader and writer. He has written articles for Technical Analysis of Stocks & Commodities, Traders.com Advantage,Futuresmag.com and, Finance Magnates. Author of website Four Dimension Trading.
PRINT THIS ARTICLE
MARKET TIMING
Trading the Cusp of a New Year
12/28/16 04:48:08 PMby Mark Rivest
Looking to profit from the new year? Learn what opportunities 2017 offers.
Position: Sell
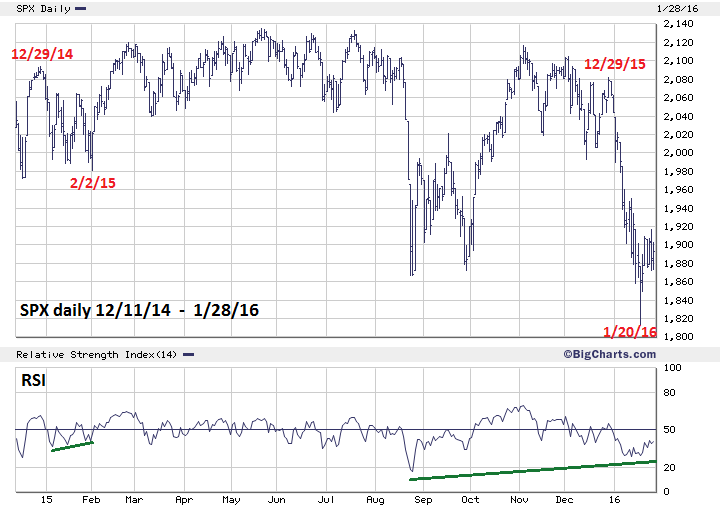
| Dynamic market action up or down can sometimes come at the start of a new year. Cash from selling prior year losing positions may need to be reinvested, or deferring taxes by selling winning positions in the new year. The direction a market is taking prior to the new year will be a main determinant to the direction in the beginning of the new year. Sentiment and momentum evidence can greatly increase your chances of trading the right direction. The stock market could begin 2017 with a powerful move. We can be prepared by examining prior new years' trading along the technical condition of the stock market in late 2016. New Year Turns 2012-2015 The S&P 500 (SPX) has had new year turns in three of the last four years. On November 16, 2012, the SPX completed an intermediate correction at 1343 then had a small rally followed by a small correction to 1398 on December 31, 2012. January 2, 2013 the SPX rose 36 points. The subsequent rally lasted until May 22nd topping at SPX 1687 before going into an intermediate correction. The 2013/2014 new year had no dynamic movement as the SPX remained in a narrow range for three weeks. Please see the daily SPX chart 2014-2016 illustrated in Figure 1. December 29, 2014 the SPX reach an all-time high of 2093. In the next five trading days it declined just over 100 points. The correction completed on February 2nd at SPX 1980. December 29, 2015 SPX made a tertiary peak at 2081, then declined the final two trading days of 2015. At the intraday low on January 4th the SPX was down 54 points. Subsequently, the SPX went to the first of two bottoms January 20th at 1812. Please see my January 22, 2016 article "Signature of an Important Bottom". The shallow SPX pullback from its December 13, 2016 high could be analogous to what happened at the 2012/2013 turn. Evidence from the dimensions of Momentum and Sentiment hint at something else developing. |
|
| Figure 1. On December 29, 2014 the SPX reached an all�time high of 2093. In the next five trading days it declined just over 100 points. |
| Graphic provided by: BigCharts.com. |
| |
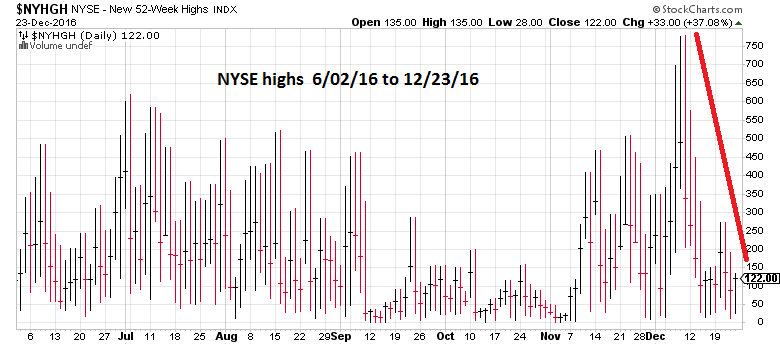
| Momentum Dimension Please see the NYSE — New 52-Week High chart illustrated in Figure 2. On December 9th, new highs reached 778. Just two trading days later when the SPX achieved its closing high at 2271, new highs collapsed to 449. On December 23rd with the SPX just eight points lower, there were only 122 new highs. The broader market is pulling away from the SPX, and has very bearish implications for the near future. |
|
| Figure 2. The broader market is pulling away from the SPX, and has very bearish implications for the near future. |
| Graphic provided by: StockCharts.com. |
| |
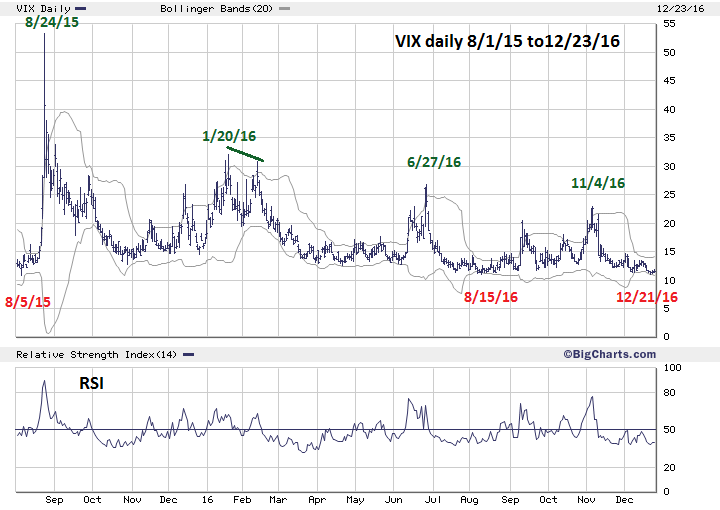
| Sentiment Dimension Please see the VIX daily chart illustrated in Figure 3. Using Bollinger Bands with the VIX is very effective in finding SPX bottoms. Sharp spikes above the upper band usually indicate selling exhaustion. Also, note the powerful double signal made on February 11th when the SPX went marginally below its January 20th bottom. The VIX spiked and registered a bullish divergence vs. the SPX new low. Finding SPX tops is different in that the VIX almost always needs to register a higher low vs. a SPX higher high. On December 21st, the VIX reached 10.93. This is the lowest level since the current leg of the bull market began on February 11, 2016. However, it held above the 10.88 reading made on August 5, 2015. Near term, the implication is for the SPX to make at least one new closing high. The implications from the VIX being near the level recorded on August 15, 2015 are very bearish. Eight trading days after August 5, 2015 the SPX began the mini crash when it dropped 10% in just five trading days. The Market Vane Bullish Consensus reading for the week of December 19-23 was 65% down — only 1% from the prior week reading. 66% and 65% are levels associated with significant stock market peaks. |
|
| Figure 3. The implications from the VIX being near the level recorded on August 5, 2015 are very bearish. |
| Graphic provided by: BigCharts.com. |
| |
| Summary and Strategy The following is the weight of technical analysis evidence noted in this article and my articles from my December 7th, 14th, and 20th: Bearish Evidence Price Dimension 1) SPX 2/3 Fibonacci ratio between 2009-2010 bull wave and 2010-2016 bull wave. 2) SPX holds below the rising trend line from April 2016-December 2016. 3) SPX holds below important Fibonacci resistance point at 2285.92. Momentum Dimension 1) Three of the Nine SPX Sectors are lagging the SPX. 2) New 52-Week highs have collapsed. 3) Dow Jones Industrial Average, Nasdaq Composite, and SPX have daily MACD bearish divergences at their recent highs. 4) Russell 2000, and Dow Jones Transportation Average failed to confirm recent new highs in the three main US stock indices. Sentiment Dimension 1) Recent Market Vane Bullish Consensus readings are at levels coincident with important tops. 2) VIX has reached the level coincident with the SPX 2015 pre-mini crash top. Time Dimension 1) SPX 2010-2011 bull wave exactly equal to the SPX February-December 2016 bull wave. Bullish Evidence Momentum Dimension 1) SPX daily RSI has no bearish divergence. Sentiment Dimension 1) VIX has no short-term divergence. Time Dimension 1) Seasonal patterns are bullish until mid-April. My last article "Stock Market Bears Hold the One Yard Line" noted that the SPX holding below 2285.92 and closing the week of December 23rd down, could be the start of a powerful decline. The SPX held below 2285.92 and went up for the week. This opens the door for the SPX to make at least a marginal new high. If the SPX has not traded above 2285.92: Short 50% as soon as possible and use SPX 2285.93 as the stop loss. If still holding long stock positions, early January could be the last time to liquidate at the most advantageous prices. The weight of evidence strongly suggests an important stock market top is either in place or will be very soon. The first trading day of 2017 could be the most important day of the new year. A move down may be the beginning of a multi-week decline. If the first day is up, the bulls will probably continue the rally. Happy New Year to all! Further Reading: Frost A.J and Robert Prechter (1985) "Elliott Wave Principle", New Classics Library. |
Independent investment advisor, trader and writer. He has written articles for Technical Analysis of Stocks & Commodities, Traders.com Advantage,Futuresmag.com and, Finance Magnates. Author of website Four Dimension Trading.
| Website: | www.fourdimensiontrading.com |
| E-mail address: | markrivest@gmail.com |
Click here for more information about our publications!
Comments
Date:�12/28/16Rank:�5Comment:�Nice analysis!

Request Information From Our Sponsors
- StockCharts.com, Inc.
- Candle Patterns
- Candlestick Charting Explained
- Intermarket Technical Analysis
- John Murphy on Chart Analysis
- John Murphy's Chart Pattern Recognition
- John Murphy's Market Message
- MurphyExplainsMarketAnalysis-Intermarket Analysis
- MurphyExplainsMarketAnalysis-Visual Analysis
- StockCharts.com
- Technical Analysis of the Financial Markets
- The Visual Investor
- VectorVest, Inc.
- Executive Premier Workshop
- One-Day Options Course
- OptionsPro
- Retirement Income Workshop
- Sure-Fire Trading Systems (VectorVest, Inc.)
- Trading as a Business Workshop
- VectorVest 7 EOD
- VectorVest 7 RealTime/IntraDay
- VectorVest AutoTester
- VectorVest Educational Services
- VectorVest OnLine
- VectorVest Options Analyzer
- VectorVest ProGraphics v6.0
- VectorVest ProTrader 7
- VectorVest RealTime Derby Tool
- VectorVest Simulator
- VectorVest Variator
- VectorVest Watchdog