

HOT TOPICS LIST
- MACD
- Fibonacci
- RSI
- Gann
- ADXR
- Stochastics
- Volume
- Triangles
- Futures
- Cycles
- Volatility
- ZIGZAG
- MESA
- Retracement
- Aroon
INDICATORS LIST
LIST OF TOPICS
PRINT THIS ARTICLE
by Mark Rivest
The S&P 500 stops at important resistance and could be a top.
Position: Sell
Mark Rivest
Independent investment advisor, trader and writer. He has written articles for Technical Analysis of Stocks & Commodities, Traders.com Advantage,Futuresmag.com and, Finance Magnates. Author of website Four Dimension Trading.
PRINT THIS ARTICLE
ELLIOTT WAVE
Stock Market Bears Hold the One Yard Line
12/20/16 12:55:51 PMby Mark Rivest
The S&P 500 stops at important resistance and could be a top.
Position: Sell
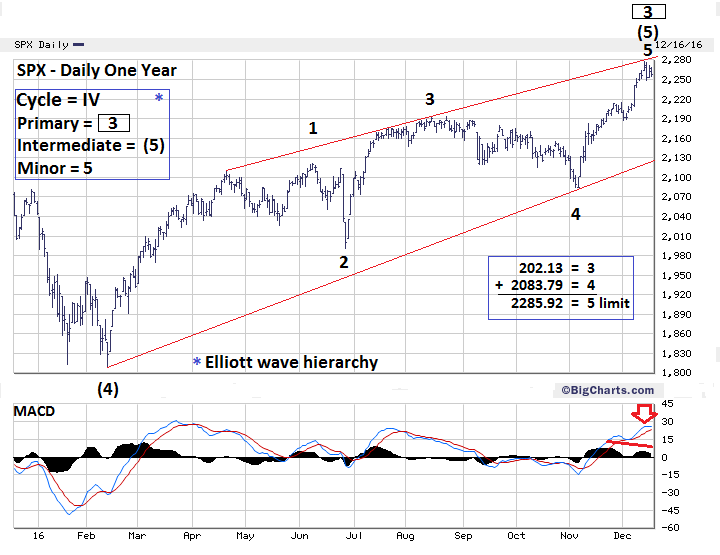
| Since November 3, 2016, stock market bulls have been on a rampage. They've smashed through chart resistance, trounced bearish momentum signals, and have disintegrated Fibonacci clusters. The last barrier to prevent the bulls from continuing the rally for the next several weeks has held — the S&P 500 (SPX) April to August rising trend line. If this were a football game the bears would be holding their own one yard line. If the bulls break through it will probably add several more weeks to the rally. Will the bears hold the trend line? Long term time cycles and price ratios indicate the bears could hold the line and begin a significant push down. S&P 500 — One Year My last article "Bull Run" illustrated the bullish Elliott wave count. This article, the focus is on the most likely bearish wave count. Please see the SPX — One Year chart illustrated in Figure 1. The SPX pattern from the February 11th bottom can count as an Ending Diagonal Triangle (EDT). This pattern occurs in the fifth wave of a five-wave structure and in wave "C" of a three-wave structure. Each sub-wave of an EDT sub divides into a three-wave structure and wave "Four" of the EDT almost always crosses over into the territory of wave "One". Minor wave "3", which peaked on August 15th, is .65 of Minor wave "1", close to .666 or 2/3 Fibonacci ratio. Minor wave "3" is also close to equal with Minor wave "5". Minor wave "2" is close to equal with Minor wave "4". The two corrective patterns follow the guideline for alternation, Minor wave "2" is a Zigzag while Minor wave "4" is a Double Zigzag. The SPX price structure from the February 11th bottom has almost all the characteristics of a completed EDT. All that remains is to not exceed SPX 2285.92. In any impulsive five wave Elliott pattern, wave "Three" can never be the shortest of the three sub impulse waves. Because Minor wave "3" is shorter than Minor wave "1", Minor wave "5" must not exceed Minor wave "3", which is SPX 2285.92 and very close to the rising trend line. |
|
| Figure 1. Minor wave "5" must not exceed Minor wave "3", which is SPX 2285.92 and very close to the rising trend line. |
| Graphic provided by: BigCharts.com. |
| |
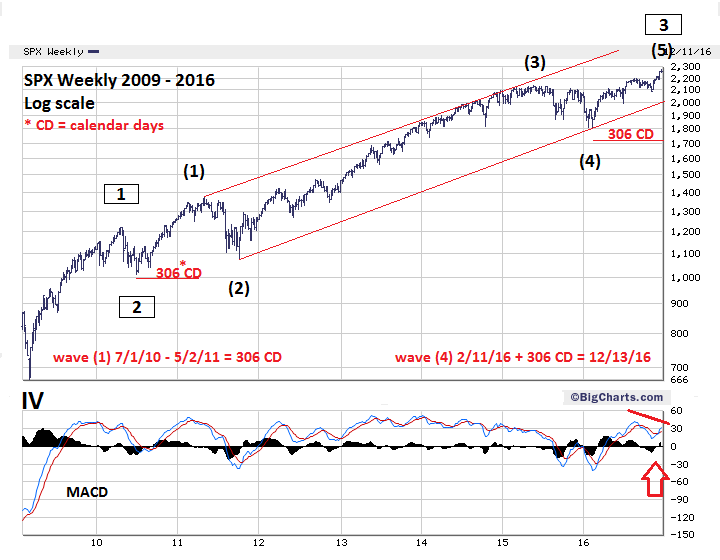
| S&P 500 from 2009-2016 Please see the SPX weekly chart 2009-2016 illustrated in Figure 2. This is an update to the weekly chart illustrated in my October 14, 2016 article "How to Find Major Turns in Any Market". Within a five-wave impulsive pattern there are usually a price and/or time relationship between waves "One" and "Five". In this situation, we're looking at a time relationship between Intermediate wave (1) July 2010 - May 2011 and Intermediate wave (5) 2016 rally. Typically waves "One" and "Five" will tend towards time equality. Intermediate waves (1) and (5) are exactly equal, as of the all-time high recorded on December 13, 2016. If this high holds it will be truly amazing considering the size of the waves and the time separating them. Also, December 13th was a full moon and it's been a long time since the US stock market had a turn on a lunar cycle. We're overdue. There's no price relationship between waves Intermediate (1) and (5). There is, however, a fascinating relationship between Primary wave "1" boxed and Primary wave "3" boxed. The percentage gain of Primary wave "1" from the major bottom at SPX 666 is 82.9%. The percentage gain from Primary wave "3" from the bottom at SPX 1010 to the all-time high of 2277 is 125.2%. 82.9/125.20 = .662 — a near perfect 2/3 Fibonacci ratio. |
|
| Figure 2. Intermediate waves (1) and (5) are exactly equal as of the all-time high recorded on December 13, 2016. |
| Graphic provided by: BigCharts.com. |
| |
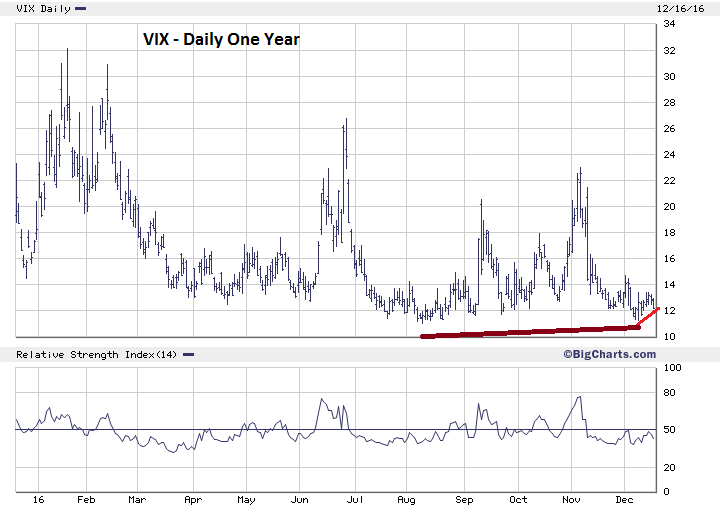
| Market Sentiment The Market Vane Bullish Consensus reading for the week of December 12th was 66%. This is the highest reading since the week of May 16th 2013 of 70%. The next closest reading was 65% made on the week of May 18th 2015. The important SPX high of 2134 was made on May 20, 2015 — not exactly the best time to go long stocks. Please see the VIX — Daily One Year chart illustrated in Figure 3. This is an update to the VIX chart illustrated in my December 7, 2016 article "A Tale of Two Stock Markets". That article noted a short term VIX divergence with the November 30th SPX peak and a multi month VIX divergence with the SPX August top. Subsequently, the short term VIX divergence was erased, while the multi-month remained. On December 13th, another short term VIX divergence has emerged. Longer term Bullish Consensus readings along with intermediate and short term VIX divergences all suggest that US stocks are at a top. |
|
| Figure 3. On December 13th, another short term VIX divergence has emerged. |
| Graphic provided by: BigCharts.com. |
| |
| Summary and Strategy (In my December 14th article, I noted a large increase of SPX and DJIA volume. The increased volume is because of a change in the way volume is recorded not from increased trading.) The SPX still has the rising trend line right near an important intermediate Fibonacci point. The recent top came exactly at major Fibonacci time cycle and price resistance. While all this is going on, major, intermediate, and short term sentiment readings indicate stocks are at a top. The game changer will be if the SPX can breach 2285.92. The SPX closed on December 16th at 2258, could hit the target in a day. I suspect it could take a lot longer than just a day. If the SPX has not traded above 2285.92: short 50% as soon as possible and use SPX 2285.93 as the stop loss. It's crunch time for the bears. For several weeks they've been beaten back relentlessly — they're on the one yard line. The SPX holding below 2285.92 and ending the week of December 23rd down, could be the start of a powerful decline lasting into at least February. If this happens the cheer should be. "GO BEARS!" Further Reading: Frost A.J and Robert Prechter (1985) "Elliott Wave Principle", New Classics Library. |
Independent investment advisor, trader and writer. He has written articles for Technical Analysis of Stocks & Commodities, Traders.com Advantage,Futuresmag.com and, Finance Magnates. Author of website Four Dimension Trading.
| Website: | www.fourdimensiontrading.com |
| E-mail address: | markrivest@gmail.com |
Click here for more information about our publications!
Comments
Date:�12/23/16Rank:�4Comment:�

Request Information From Our Sponsors
- StockCharts.com, Inc.
- Candle Patterns
- Candlestick Charting Explained
- Intermarket Technical Analysis
- John Murphy on Chart Analysis
- John Murphy's Chart Pattern Recognition
- John Murphy's Market Message
- MurphyExplainsMarketAnalysis-Intermarket Analysis
- MurphyExplainsMarketAnalysis-Visual Analysis
- StockCharts.com
- Technical Analysis of the Financial Markets
- The Visual Investor
- VectorVest, Inc.
- Executive Premier Workshop
- One-Day Options Course
- OptionsPro
- Retirement Income Workshop
- Sure-Fire Trading Systems (VectorVest, Inc.)
- Trading as a Business Workshop
- VectorVest 7 EOD
- VectorVest 7 RealTime/IntraDay
- VectorVest AutoTester
- VectorVest Educational Services
- VectorVest OnLine
- VectorVest Options Analyzer
- VectorVest ProGraphics v6.0
- VectorVest ProTrader 7
- VectorVest RealTime Derby Tool
- VectorVest Simulator
- VectorVest Variator
- VectorVest Watchdog