

HOT TOPICS LIST
- MACD
- Fibonacci
- RSI
- Gann
- ADXR
- Stochastics
- Volume
- Triangles
- Futures
- Cycles
- Volatility
- ZIGZAG
- MESA
- Retracement
- Aroon
INDICATORS LIST
LIST OF TOPICS
PRINT THIS ARTICLE
by Mark Rivest
Is the May 16-18 sharp stock market decline the start of a bear market?
Position: N/A
Mark Rivest
Independent investment advisor, trader and writer. He has written articles for Technical Analysis of Stocks & Commodities, Traders.com Advantage,Futuresmag.com and, Finance Magnates. Author of website Four Dimension Trading.
PRINT THIS ARTICLE
MARKET TIMING
The Bear Awakens
05/31/17 02:44:49 PMby Mark Rivest
Is the May 16-18 sharp stock market decline the start of a bear market?
Position: N/A
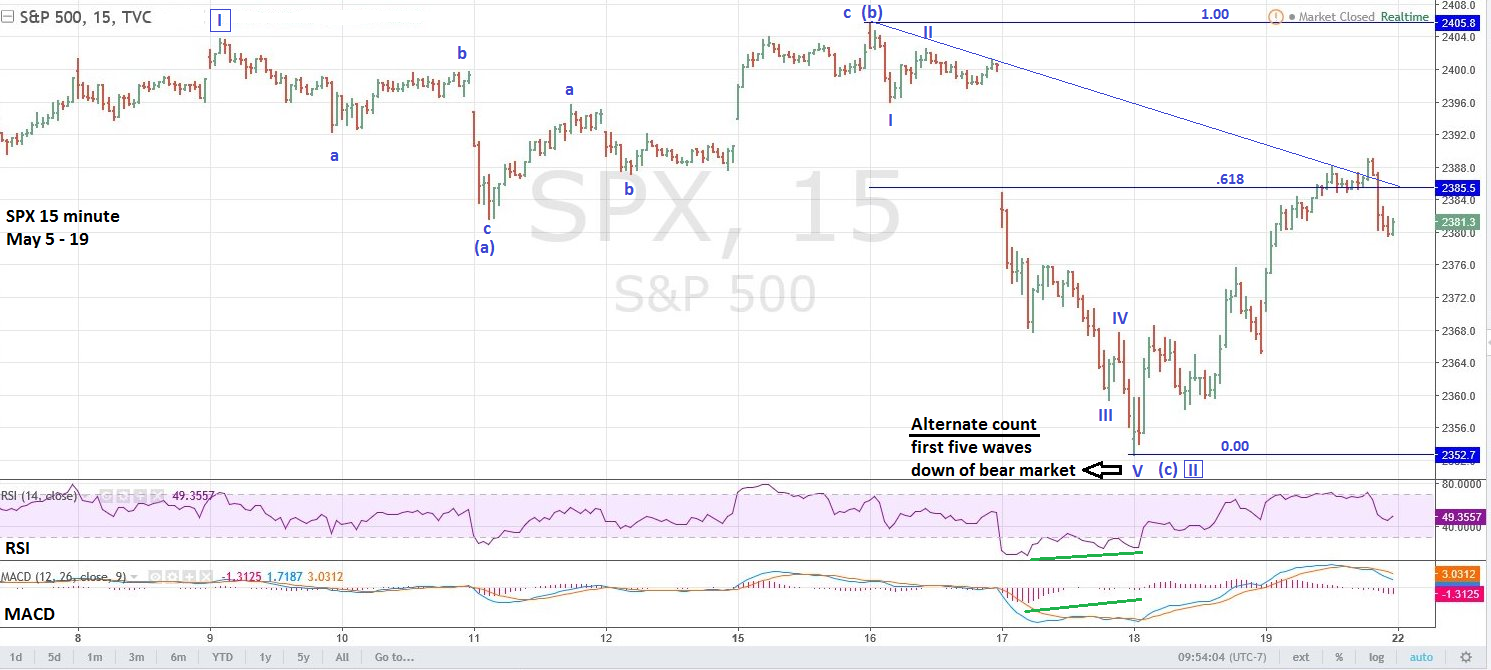
| April to May is seasonally a time for the US stock market to make a top. Sentiment has been bullish for several months, usually signaling a stock market rally is extended. Momentum has been weakening while the S&P 500 (SPX) has been rallying to a Fibonacci cluster in the 2450-2460 area. The SPX all-time high May 16th has all the ingredients for what could be a major top, except for reaching the Fibonacci price cluster. Nothing's predestined in markets, the mass-mind can change its opinion at any moment. It's possible that round number resistance at SPX 2400 could be a resistance magnet that ends the bull market. The evidence could tell us if we are witnessing the birth of a bear market. S&P 500 Intraday Please see the SPX 15-minute chart illustrated in Figure 1. The pattern from the SPX high of 2403.90 on May 9th to the bottom at 2352.70 on May 18th is a text book Elliott wave Expanding Flat correction. In this formation, the first decline labeled (a) subdivides into three waves. The subsequent rally labeled (b) subdivides into three waves and exceeds the point of origin of wave (a). The next decline labeled (c) subdivides into five waves and exceeds the termination point of wave (a). The bearish alternate count to this pattern is that the supposed wave (c) clear five wave subdivision could also be the first wave down of a larger developing downward trend. The rally from the bottom at 2352.70 has moved above both .618 Fibonacci resistance and the declining trendline. This implies the bulls have the advantage and could move the SPX to at least the high at 2405.80. SPX 2352.70 is very important support, a break below this level could open the door for a decline to at least the 2320-2330 area. |
|
| Figure 1. SPX 2352.70 is very important support, a break below this level could open the door for a decline to at least the 2320�2330 area. |
| Graphic provided by: Tradingview.com. |
| |
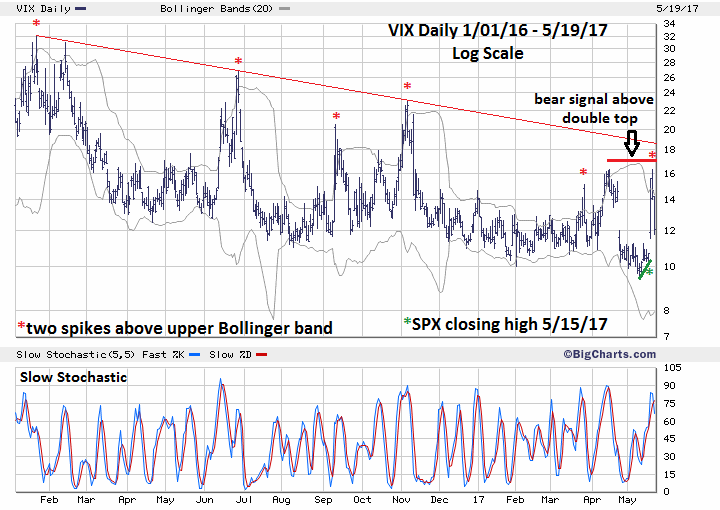
| VIX Daily Please see the VIX daily chart illustrated in Figure 2. There's a wealth of information on this chart, starting with the VIX bottom made on May 9th. SPX bull markets almost always terminate with a VIX divergence. My May 18th article, "Stock Market Into The Cross Hair", noted this was bullish for the SPX and that it would take at least one SPX close above 2403.90 with the VIX closing above its May 9th low for a potential SPX top signal. Subsequently, the SPX had a tiny rally with a closing high of only 2402.30, with the VIX above its May 9th low. The SPX's inability to close above 2403.90 is a weak signal and implies that the subsequent decline was only a correction in an ongoing bull market. Also note the various VIX double spikes above the upper Bollinger band. Most of the time at least two spikes above the upper band correspond with SPX bottoms. After the spikes VIX declines for at least several days while the SPX rises. Note that as of May 19th there has, so far, been only one VIX day of decline, implying several more days of decline and potentially several days of the SPX rising. Finally, there is the declining trendline from the January 2016 peak to present and the VIX April and May double top. There is a high probability that a subsequent move above both these VIX resistance levels could be a powerful signal that at least an intermediate SPX decline is underway. Keep watching the VIX. |
|
| Figure 2. Most of the time at least two spikes above the upper band correspond with SPX bottoms. |
| Graphic provided by: BigCharts.com. |
| |
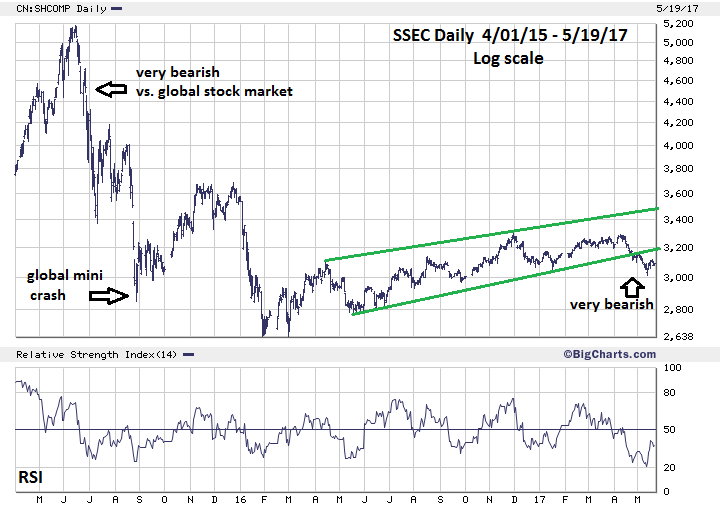
| Shanghai Composite Daily Please see the daily Shanghai Composite (SSEC) chart in Figure 3. From June to July in 2015 the SSEC declined a staggering 34%, at the same time the SPX declined only 2%. German DAX and UK-FTSE also had declines far less than the SSEC. This relative weakness of the SSEC was the prelude to the global mini stock market crash of August 2015. In May 2017, the SSEC is 6% below its April 2017 peak, which itself is well below its 2015 peak. From April to May 2017 the SPX is up 1% and just below its all-time high. Both the DAX and FTSE are just off their all-time highs. While so far the SSEC decline is not as dramatic as the 2015 drop, it's very curious that the stock market of the world's second largest economy continues to underperform by such a large degree. Keep watching the SSEC. |
|
| Figure 3. While so far, the SSEC decline is not as dramatic as the 2015 drop, it�s very curious that the stock market of the world�s second largest economy continues to underperform by such a large degree. |
| Graphic provided by: BigCharts.com. |
| |
| Time Cycles Seasonally, April-May is the most likely time for US stocks to peak while November is usually the most bullish month of the year. Because of this reliability, counter seasonal moves can give important clues to the broader market direction. November 2007 was a classic example. That month the SPX declined 4.4% — not much — but it was a subtle signal that a larger bear trend was underway. If the SPX has a significant rally beyond May 2017 and is still rising into late June this could be a signal of the bull market continuing until at least August. If the SPX peak made on May 16th holds for the rest of May, this could be a signal of a significant top in place. My April 12th article "Termination Date" noted June 2nd as a possible termination date for Minor wave "5". This was derived by adding the 47 trading days of Minor wave "1" — the February to April 2016 rally — to the March 27, 2017 bottom. However, this date now appears to be the low point of a probable Minor wave "4" Horizontal Triangle which ended on April 19th. Multiplying 47 trading days by .618 equals 29 trading days, adding this to April 19th targets May 31st. This is fascinating, because my April 12th article noted a longer-term Fibonacci time cycle that targeted May 30th as a potential turn date. A significant SPX peak could come May 30-June 2 with May 31st as the bullseye date. |
| Summary and Strategy Never fall in love with a forecast. They can help to guide through the twists and turns of any market, but nothing is predestined. Markets can, and will, change their mind at any moment. There is enough evidence that suggests US stock are near at least an intermediate peak, possibly a major top. If the SPX breaks below the recent bottom at 2352.70 any time in May before it makes a new all-time high, there is a very good chance that the 2405.80 top could hold for at least several months. If the SPX rally continues it will probably be drawn to major Fibonacci resistance at 2450-2460. The weight of evidence, particularly from the VIX, indicates the stock bull market will continue. Short 50% stocks if the SPX moves above 2420. Use 2510 as a stop loss. Further Reading: Frost A.J and Robert Prechter (1985) "Elliott Wave Principle", New Classics Library. |
Independent investment advisor, trader and writer. He has written articles for Technical Analysis of Stocks & Commodities, Traders.com Advantage,Futuresmag.com and, Finance Magnates. Author of website Four Dimension Trading.
| Website: | www.fourdimensiontrading.com |
| E-mail address: | markrivest@gmail.com |
Click here for more information about our publications!
Comments
Date:�06/01/17Rank:�5Comment:�

Request Information From Our Sponsors
- StockCharts.com, Inc.
- Candle Patterns
- Candlestick Charting Explained
- Intermarket Technical Analysis
- John Murphy on Chart Analysis
- John Murphy's Chart Pattern Recognition
- John Murphy's Market Message
- MurphyExplainsMarketAnalysis-Intermarket Analysis
- MurphyExplainsMarketAnalysis-Visual Analysis
- StockCharts.com
- Technical Analysis of the Financial Markets
- The Visual Investor
- VectorVest, Inc.
- Executive Premier Workshop
- One-Day Options Course
- OptionsPro
- Retirement Income Workshop
- Sure-Fire Trading Systems (VectorVest, Inc.)
- Trading as a Business Workshop
- VectorVest 7 EOD
- VectorVest 7 RealTime/IntraDay
- VectorVest AutoTester
- VectorVest Educational Services
- VectorVest OnLine
- VectorVest Options Analyzer
- VectorVest ProGraphics v6.0
- VectorVest ProTrader 7
- VectorVest RealTime Derby Tool
- VectorVest Simulator
- VectorVest Variator
- VectorVest Watchdog