

HOT TOPICS LIST
- MACD
- Fibonacci
- RSI
- Gann
- ADXR
- Stochastics
- Volume
- Triangles
- Futures
- Cycles
- Volatility
- ZIGZAG
- MESA
- Retracement
- Aroon
INDICATORS LIST
LIST OF TOPICS
PRINT THIS ARTICLE
by Mark Rivest
Basic techniques to count and identify waves.
Position: N/A
Mark Rivest
Independent investment advisor, trader and writer. He has written articles for Technical Analysis of Stocks & Commodities, Traders.com Advantage,Futuresmag.com and, Finance Magnates. Author of website Four Dimension Trading.
PRINT THIS ARTICLE
ELLIOTT WAVE
Elliott Wave Lesson
01/30/20 04:23:44 PMby Mark Rivest
Basic techniques to count and identify waves.
Position: N/A
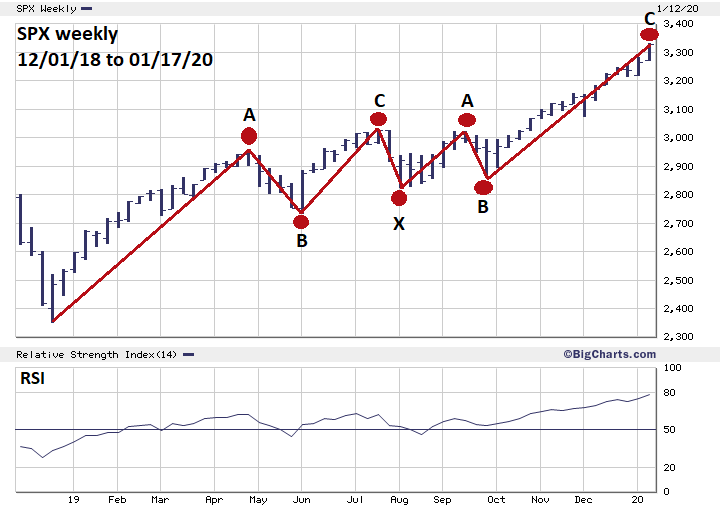
| Many traders/analysts believe that the Elliott wave methodology is extremely complex and difficult to understand. The method is easy to understand after you've learned the four main rules and can recognize the patterns. This article, which deals with the equity market, in particular the S&P 500 (SPX), can be used as a starting point to discover amazing aspects of the Elliott wave theory. S&P 500 - Bearish Wave Count When counting waves of any size, have an alternate wave count contrary to your belief of the primary trend. If you're bullish on a market, look for the bearish Elliott wave interpretation; if you're bearish look for the bullish alternate. Elliott waves represent the mass mind of humanity, and like an individual that mind can change direction. Counting Elliott waves is a simple matter of breaking a market into segments — start with the most significant high or low and then follow the market until the next significant high or low is reached. The SPX had a very significant bottom made in March 2009; following the SPX from that point there have been four declines in the range of 15 to 20%. Please see the weekly SPX chart illustrated in Figure 1. This chart begins at the bottom of the fourth correction made in December 2018. Sometimes the smaller wave subdivisions can cause confusion. To clear up the situation simply make and connect dots at the termination point of each market movement. In this situation there are seven termination points — drawing lines reveals a possible Double Zigzag formation. This pattern from the last correction bottom has exceeded that correction's point of origin made in September 2018. If this count is correct it could be wave "B" of an Expanding Flat or a Running Horizontal Triangle. The middle portion of a Combination wave is another possibility; if so, the next subsequent decline could at least exceed the bottom made in December 2018. An Expanding Flat has the same downside potential. The Running Horizontal Triangle's most likely downside potential is a 60 to 66% retrace of the rally from the December 2018 bottom. |
|
| Figure 1. Counting Elliott waves is a simple matter of breaking a market into segments. |
| Graphic provided by: BigCharts.com. |
| |
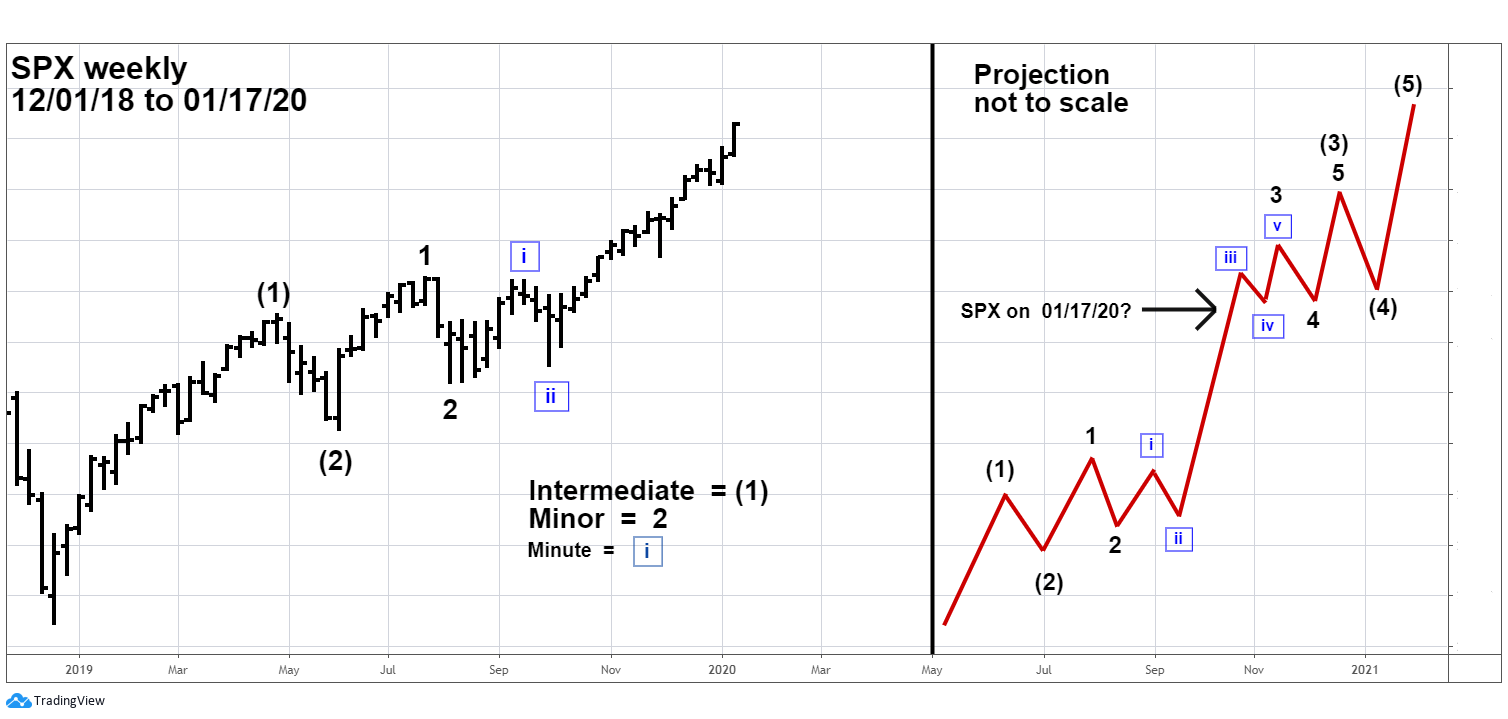
| S&P 500 Bullish Wave Count Please see the weekly SPX chart with projection illustrated in Figure 2. My December 12, 2019 article "Stock Market Super Bullish Scenario" noted SPX from December 2018 could be forming a series of ones and twos — the prelude to a very strong steady and relentless third of a third wave. This is exactly what has happened. The projection illustrates higher prices for at least the next several months. As of mid-January 2020, is the SPX on the verge of significant decline or will it continue the bullish trend? How can an analyst/trader determine which Elliott wave count is correct? One of the answers comes from Fibonacci analysis. |
|
| Figure 2. The projection illustrates higher prices for at least the next several months. |
| Graphic provided by: tradingview.com. |
| |
| Discovering Fibonacci Clusters Two or more Fibonacci coordinates close together usually represent significant support/resistance for any market. The greater number of Fibonacci coordinates the stronger the potential support/resistance. Can these barriers be broken? Yes, if there's sufficient force. My February 1, 2018 article "How High is Up" noted an SPX Fibonacci cluster with a bullseye at 3047. The powerful rally that began October 3, 2019 punched right through this potential resistance. My June 28, 2019 article "Setting Trading Targets" noted a higher SPX Fibonacci cluster; one coordinate was at SPX 3308 and two coordinates hit 3318. On January 17, 2020 the SPX high was 3329. Always allow for leeway around Fibonacci targets; in this situation one of the coordinates originates in March 2009 considerably lower than today's prices. With that large of a percentage gain, leeway up to SPX 3350 is reasonable. It's possible in mid-January 2020 the SPX could be at or near significant resistance. Is there a way to determine if the barrier could be broken? The answer comes from beyond the Price dimension. |
|
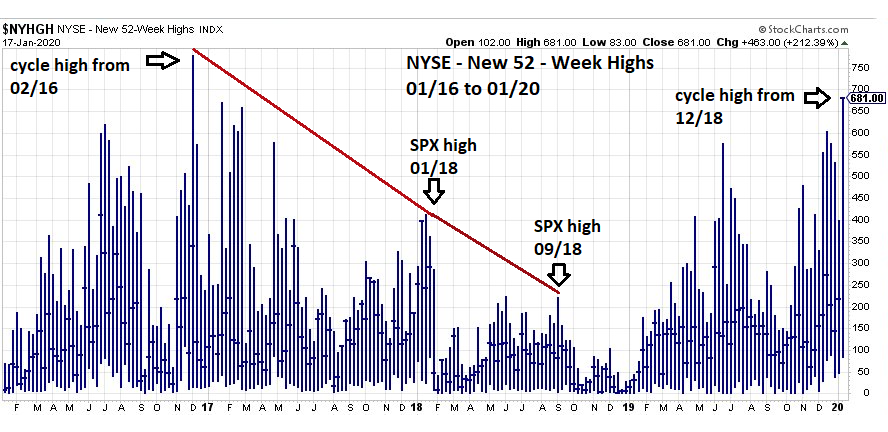
| Figure 3. On January 17, 2020, $NYHGH made a new high for the market segment that began in late December 2018. |
| Graphic provided by: StockCharts.com. |
| |
| Momentum and Time Dimensions Elliott wave analysis can be subjective. Price patterns and Fibonacci levels are within the realm of the Price Dimension. To obtain an objective perspective, Elliott wave theory must be used in conjunction with evidence from the other three market dimensions: Momentum, Time and Sentiment. Please see the NYSE New 52-week highs chart illustrated in Figure 3. This is an update to the NYSE New 52-week high chart ($NYHGH) shown in my December 20, 2019 article "Stock Market Momentum Cycles". On January 17, 2020, $NYHGH made a new high for the market segment that began in late December 2018. Stock market internal momentum — the number of stocks making new 52-week highs — normally will peak several months before the stock bull market or segment price high. $NYHGH high for the SPX segment February 2016 to September 2018 came in December 2016. Assuming the $NYHGH high made January 17, 2020 is the maximum for the current segment that began December 2018, the next SPX price peak could come nineteen months later. However, the main bull market began in March 2009, which so far has a maximum $NYHGH recorded in 2012. The next segment that began February 2016 registered less $NYHGH maximum highs. It's logical to expect the current segment to have a smaller maximum than the prior segment. The 2016 to 2018 segment had two significant momentum divergences. The first occurred in January 2018, fourteen months after maximum momentum. Perhaps the current segment price high could come fourteen months after January 2020, which targets March 2021 the same bullseye target date noted in my January 9, 2020 article "Forecast For US Stocks in 2020" Time dimension is bullish — US stocks usually rally from November to April. |
| Summary In mid-January 2020, evidence from the Momentum and Time dimensions favors the bullish Elliott wave count. If the Fibonacci cluster in the low 3300 area does prove to be a barrier it may only be a short-term top that could be exceeded later in the year. The bearish wave count still needs to be respected; there are no certainties in the markets, only probabilities. An SPX decline greater than 5% anytime in the next several weeks could be a caution sign of a larger developing bear movement. Key points when using the Elliott wave methodology. 1) Always have an alternate wave count. 2) Divide markets into segments. 3) Search for Fibonacci clusters 4) Examine evidence from the dimensions of Time, Momentum and Sentiment. Further Reading: Frost A.J and Robert Prechter (1985) "Elliott Wave Principle", New Classics Library. Prechter Jr. R. Robert (2003) "Beautiful Pictures", New Classics Library. |
Independent investment advisor, trader and writer. He has written articles for Technical Analysis of Stocks & Commodities, Traders.com Advantage,Futuresmag.com and, Finance Magnates. Author of website Four Dimension Trading.
| Website: | www.fourdimensiontrading.com |
| E-mail address: | markrivest@gmail.com |
Click here for more information about our publications!
PRINT THIS ARTICLE

Request Information From Our Sponsors
- StockCharts.com, Inc.
- Candle Patterns
- Candlestick Charting Explained
- Intermarket Technical Analysis
- John Murphy on Chart Analysis
- John Murphy's Chart Pattern Recognition
- John Murphy's Market Message
- MurphyExplainsMarketAnalysis-Intermarket Analysis
- MurphyExplainsMarketAnalysis-Visual Analysis
- StockCharts.com
- Technical Analysis of the Financial Markets
- The Visual Investor
- VectorVest, Inc.
- Executive Premier Workshop
- One-Day Options Course
- OptionsPro
- Retirement Income Workshop
- Sure-Fire Trading Systems (VectorVest, Inc.)
- Trading as a Business Workshop
- VectorVest 7 EOD
- VectorVest 7 RealTime/IntraDay
- VectorVest AutoTester
- VectorVest Educational Services
- VectorVest OnLine
- VectorVest Options Analyzer
- VectorVest ProGraphics v6.0
- VectorVest ProTrader 7
- VectorVest RealTime Derby Tool
- VectorVest Simulator
- VectorVest Variator
- VectorVest Watchdog