

HOT TOPICS LIST
- MACD
- Fibonacci
- RSI
- Gann
- ADXR
- Stochastics
- Volume
- Triangles
- Futures
- Cycles
- Volatility
- ZIGZAG
- MESA
- Retracement
- Aroon
INDICATORS LIST
LIST OF TOPICS
PRINT THIS ARTICLE
by Mark Rivest
See where and when the relentless US stock market rally could end.
Position: N/A
Mark Rivest
Independent investment advisor, trader and writer. He has written articles for Technical Analysis of Stocks & Commodities, Traders.com Advantage,Futuresmag.com and, Finance Magnates. Author of website Four Dimension Trading.
PRINT THIS ARTICLE
ELLIOTT WAVE
How High is Up?
02/01/18 04:35:09 PMby Mark Rivest
See where and when the relentless US stock market rally could end.
Position: N/A
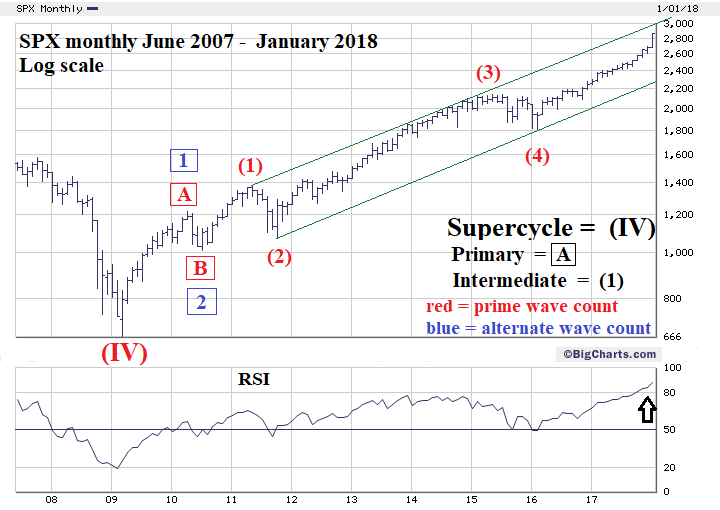
| Nature has many examples of very precise cycles. Migratory birds every year will return to the same exact area at the same exact time. Humans, individually, and as a group, can have very precise cycles. However, we think, we learn, we remember, and cycles will change. Elliott wave theory provides the best tools to track the cyclical growth of the mass human mind. A main element of the theory is that form is constant - size will vary. During 2017 the US stock market provided an excellent example of how the mass human mind can change, and where it could travel in 2018 and beyond. S&P 500 - Price Forecast Within most Elliott five wave impulse patterns one of the sub impulse waves will be extended. An extension is an elongated impulse wave, analogous to an extending telescope. Extensions can't be forecasted, they're discovered when price exceeds the termination point of a fifth wave. Extensions are one of the ways Elliott wave theory allows for the mass mind to change its opinion. For example, if fundamentals are expected to improve/worsen the impulse wave will extend. The S&P 500 (SPX) from February 2016 to mid-2017 could have been counted as a completed five wave pattern, implying a significant down turn was imminent. What's happened since mid-2017 has been an Elliott third wave extension and has continued into late January 2018. Extensions usually occur within third waves for stock indices. They are steady with brief and shallow corrections. Please see the monthly SPX chart illustrated in Figure 1. An example of an extended third wave occurred from the 2011 bottom - 2015 top, labeled Intermediate wave (3). It's a larger analogy of the wave that began at the November 2016 bottom and continuing into 2018. Also note the rising trend line which has been illustrated in several of my articles. With price now approaching the line it becomes a factor in determining resistance. Another tool to determine resistance/support are Fibonacci extensions/retracements. Using the 2007-2009 decline is the starting point to discovering resistance by using an extension. This decline was 909.30 SPX points multiplied by 1.618 equals 1471.21 added to the major bottom at 666.79 targets resistance at SPX 2138.03. The SPX top in May 2015 was 2134.72. Please see my June 8, 2015 article "The Golden Section". Using 909.30 multiplied by 2 equals 1818.60 added to 666.79 targets SPX 2485.39. When the SPX significantly exceeded this level in September 2017 it was a major clue the bull market could continue. The next significant Fibonacci extension is 2.618 multiplied by 909.30 equals 2380.54 added to 666.79 targets SPX 3047.33 which is close to where the rising trend line will be in a few months. The alternate wave count - in blue - illustrates another way the mass mind can change. If perhaps the SPX peaks later in 2018 this could be just an intermediate top prior to a multi-month decline, then another rally that could last into 2019 or beyond. |
|
| Figure 1. An example of an extended third wave occurred from the 2011 bottom � 2015 top, labeled Intermediate wave (3). |
| Graphic provided by: BigCharts.com. |
| |
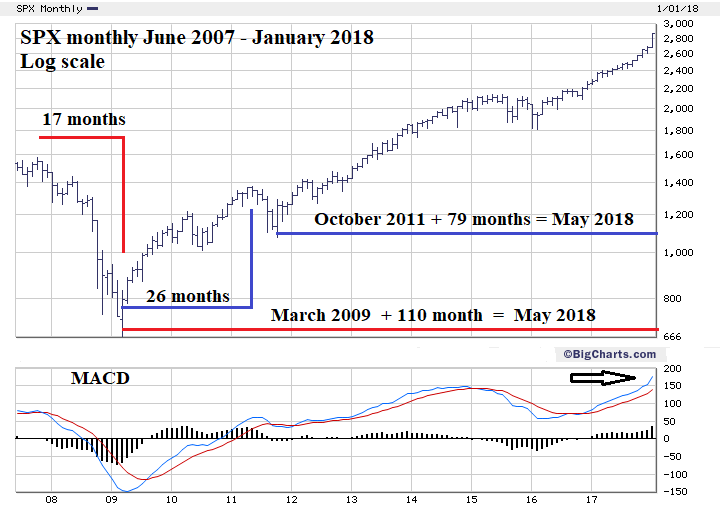
| S&P 500 - Time Forecast In addition to discovering the wave theory, R.N Elliott also discovered that markets will sometimes move in lengths measured by the Fibonacci sequence which is; 1, 1, 2, 3, 5, 8, 13, 21, 34, 55, 89, 144, — to infinity. For example, the 1929 to 1932 bear market was thirty-four months, and the 1932 to 1937 bull market was five years. More recent examples are the bull market from the 1987 crash low to 2000 was thirteen years. The bull market from 2002 to 2007 was five years. Robert Prechter noted in his terrific book "Beautiful Pictures" that market movement can be measured in multiples of the Fibonacci sequence. The 1932 to 2000 secular bull market was 68 years (2 x 34). In the 2007 to 2009 bear market something different happened, the decline was 17 months - not a Fibonacci sequence number. It is, however, (.50 x 34). The year 2017 could have been the termination point of the bull that began eight years ago but it wasn't. Does this mean the bull market that began in 2009 will continue until 2022 — thirteen years? It's possible, but there could be another turning point before then. Please see the SPX monthly chart illustrated in Figure 2. Adding 110 months (2 x 55) to the March 2009 bottom targets May 2018; this is around the time SPX price could reach the rising trend line and Fibonacci price resistance at 3047. May is also seasonal topping zone for US stocks. Additionally, there's a web of Fibonacci time sequence ratios from the 2007 top. The 2007 to 2009 decline is 17 months and the bull market segment from 2009 to 2011 is 26 months. 17/26 = .653 or a Fibonacci ratio of 2/3. The 26-month segment is .236 of the 110 months projection. The bull market segment that began October 2011 to May 2018 is 79 months. 26/79 = .329 or a Fibonacci ratio of 1/3. |
|
| Figure 2. Adding 110 months (2 x 55) to the March 2009 bottom targets May 2018. This is around the time SPX price could reach the rising trend line and Fibonacci price resistance at 3047. |
| Graphic provided by: BigCharts.com. |
| |
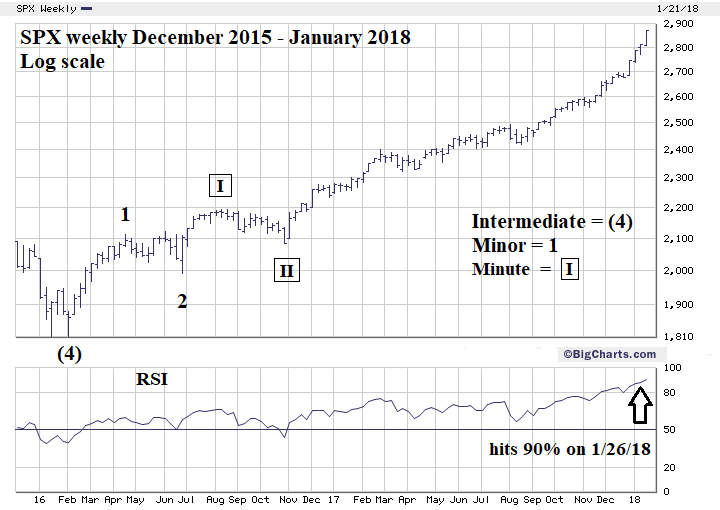
| S&P 500 - Weekly Please see the SPX weekly chart illustrated in Figure 3. Please note the similar appearance between the weekly and monthly charts, a perfect example of form remaining constant while size will vary. The Elliott wave count from February to November 2016 is what's called a series of ones and twos up. This corresponds to the alternate count on the monthly chart from 2009 to 2011. If the weekly chart count is correct Minute wave "III"-boxed is still under construction. After completion there could be about a 3 to 5% correction then another rally to new highs followed by yet another decline of about 3 to 5%. Culminating in a rally to a new all-time high, completing the move up from February 2016. |
|
| Figure 3. Please note the similar appearance between the weekly and monthly charts, a perfect example of form remaining constant while size will vary. |
| Graphic provided by: BigCharts.com. |
| |
| Conclusion and Strategy The SPX in late January 2018 is like a giant oil tanker moving at top speed. It will take time just to slow it down before changing direction. The monthly, weekly and daily RSI are all at their highest levels since the bull market began in March 2009. This and bullish seasonal patterns imply the SPX could continue to rise until May 2018. Please see my January 15 article "RSI - The Super Indicator". The Dow Jones Utility Average (DJUA) continues to look like it could be the next sector the stock market bulls focus on. Please see my January 25 article "Utility Stock Bargains". On January 26 the DJUA closed at 699.10. This appears to be Minute wave "IV"-boxed of a developing five waves down from the all-time high. If the count is correct, then the next decline could be a great time to go long Utility stocks. If the DJUA is in the range of 684 to 675, go long 25% Utility stocks or funds. Use DJUA 673 as a stop loss. Further Reading: Prechter Jr. R. Robert (2003) "Beautiful Pictures", New Classics Library. Frost A.J and Robert Prechter (1985) "Elliott Wave Principle", New Classics Library. |
Independent investment advisor, trader and writer. He has written articles for Technical Analysis of Stocks & Commodities, Traders.com Advantage,Futuresmag.com and, Finance Magnates. Author of website Four Dimension Trading.
| Website: | www.fourdimensiontrading.com |
| E-mail address: | markrivest@gmail.com |
Click here for more information about our publications!
Comments

Request Information From Our Sponsors
- StockCharts.com, Inc.
- Candle Patterns
- Candlestick Charting Explained
- Intermarket Technical Analysis
- John Murphy on Chart Analysis
- John Murphy's Chart Pattern Recognition
- John Murphy's Market Message
- MurphyExplainsMarketAnalysis-Intermarket Analysis
- MurphyExplainsMarketAnalysis-Visual Analysis
- StockCharts.com
- Technical Analysis of the Financial Markets
- The Visual Investor
- VectorVest, Inc.
- Executive Premier Workshop
- One-Day Options Course
- OptionsPro
- Retirement Income Workshop
- Sure-Fire Trading Systems (VectorVest, Inc.)
- Trading as a Business Workshop
- VectorVest 7 EOD
- VectorVest 7 RealTime/IntraDay
- VectorVest AutoTester
- VectorVest Educational Services
- VectorVest OnLine
- VectorVest Options Analyzer
- VectorVest ProGraphics v6.0
- VectorVest ProTrader 7
- VectorVest RealTime Derby Tool
- VectorVest Simulator
- VectorVest Variator
- VectorVest Watchdog