

HOT TOPICS LIST
- MACD
- Fibonacci
- RSI
- Gann
- ADXR
- Stochastics
- Volume
- Triangles
- Futures
- Cycles
- Volatility
- ZIGZAG
- MESA
- Retracement
- Aroon
INDICATORS LIST
LIST OF TOPICS
PRINT THIS ARTICLE
by Mark Rivest
See why utility stocks and funds could be near a bottom.
Since November 15, 2017 the S&P 500 (SPX) has risen 9.8%, while utility stocks, as measured by the Dow Jones Utility Average (DJUA), have declined 12.3%. Analysis of weekly and daily trends provides evidence that the DJUA could be near a bottom. The Utility sector could soon join the manic rally in US stocks.
Position: Buy
Mark Rivest
Independent investment advisor, trader and writer. He has written articles for Technical Analysis of Stocks & Commodities, Traders.com Advantage,Futuresmag.com and, Finance Magnates. Author of website Four Dimension Trading.
PRINT THIS ARTICLE
OVERBOUGHT OVERSOLD
Utility Stock Bargains
01/25/18 04:25:34 PMby Mark Rivest
See why utility stocks and funds could be near a bottom.
Since November 15, 2017 the S&P 500 (SPX) has risen 9.8%, while utility stocks, as measured by the Dow Jones Utility Average (DJUA), have declined 12.3%. Analysis of weekly and daily trends provides evidence that the DJUA could be near a bottom. The Utility sector could soon join the manic rally in US stocks.
Position: Buy
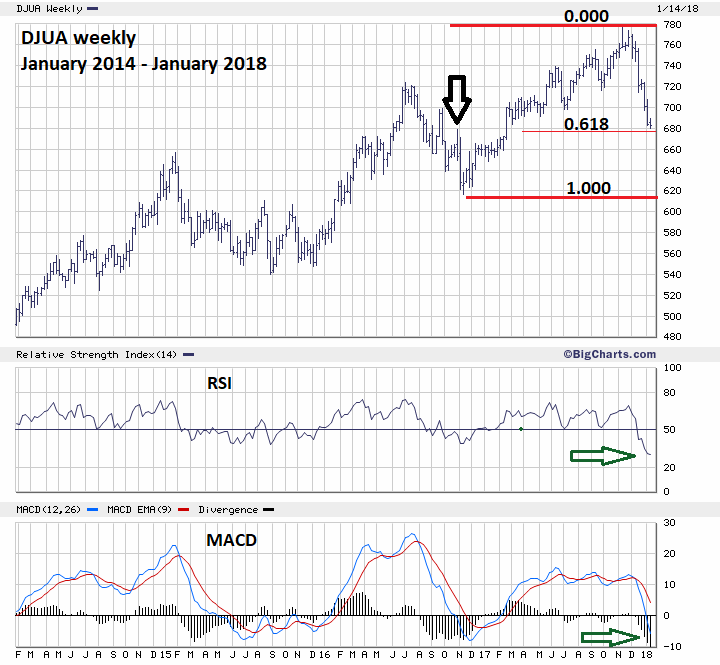
| Dow Jones Utility Average - Weekly Please see the weekly DJUA chart illustrated in Figure 1. Note that both the weekly RSI and MACD are at their most oversold levels in four years. For the sake of clearness, the scope of this chart is only four years. Expanding the scope to ten years shows that the current weekly RSI is at the second most oversold level since the major DJUA bottom of March 2009. While the current weekly MACD is at the second most oversold level since October 2008. The DJUA is very close to a significant support area. A .618 retrace of the rally from 616.19 in November 2016, to the all-time high of 778.80 in November 2017 is at 678.31. On January 16 the DJUA reached 680.01. Additionally, there's prior chart resistance at 679.09 made in October 2016. The DJUA zone of 778.00 to 780.00 could be where the Utility stock bulls live. |
|
| Figure 1. Note that both the weekly RSI and MACD are at their most oversold levels in four years. |
| Graphic provided by: BigCharts.com. |
| |
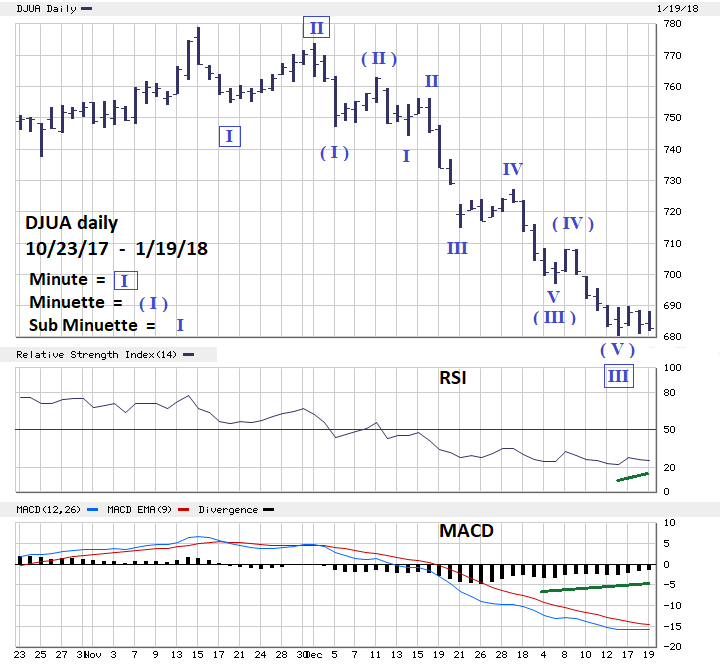
| Dow Jones Utility Average - Daily Please see the daily DJUA chart illustrated in Figure 2. The Elliott wave count from the November 15 top is exceptionally clear. Either a three-wave correction is complete at the January 16 bottom or an extended five wave pattern is still developing. The steady form of the decline strongly favors a five-wave pattern in development. Three-wave corrections are usually choppy. In addition, on an intraday chart the sideways correction from the January 16 bottom looks like an Elliott wave Horizontal Triangle. This structure only occurs in the fourth wave of a five-wave motive pattern. This ties in with the wave count from the November 15 top in which Minute wave "IV" boxed should be in development or complete on January 19. The length of the supposed Minute wave "II" boxed was 19.12 points. The widest length of the supposed Minute wave "IV" boxed is 9.85. A typical ratio of waves "two" and "four" is .50. As of January 19, the ratio of Minute wave "IV" to Minute wave "II" is 9.85/19.12 = .51. |
|
| Figure 2. The steady form of the decline strongly favors a five-wave pattern in development. |
| Graphic provided by: BigCharts.com. |
| |
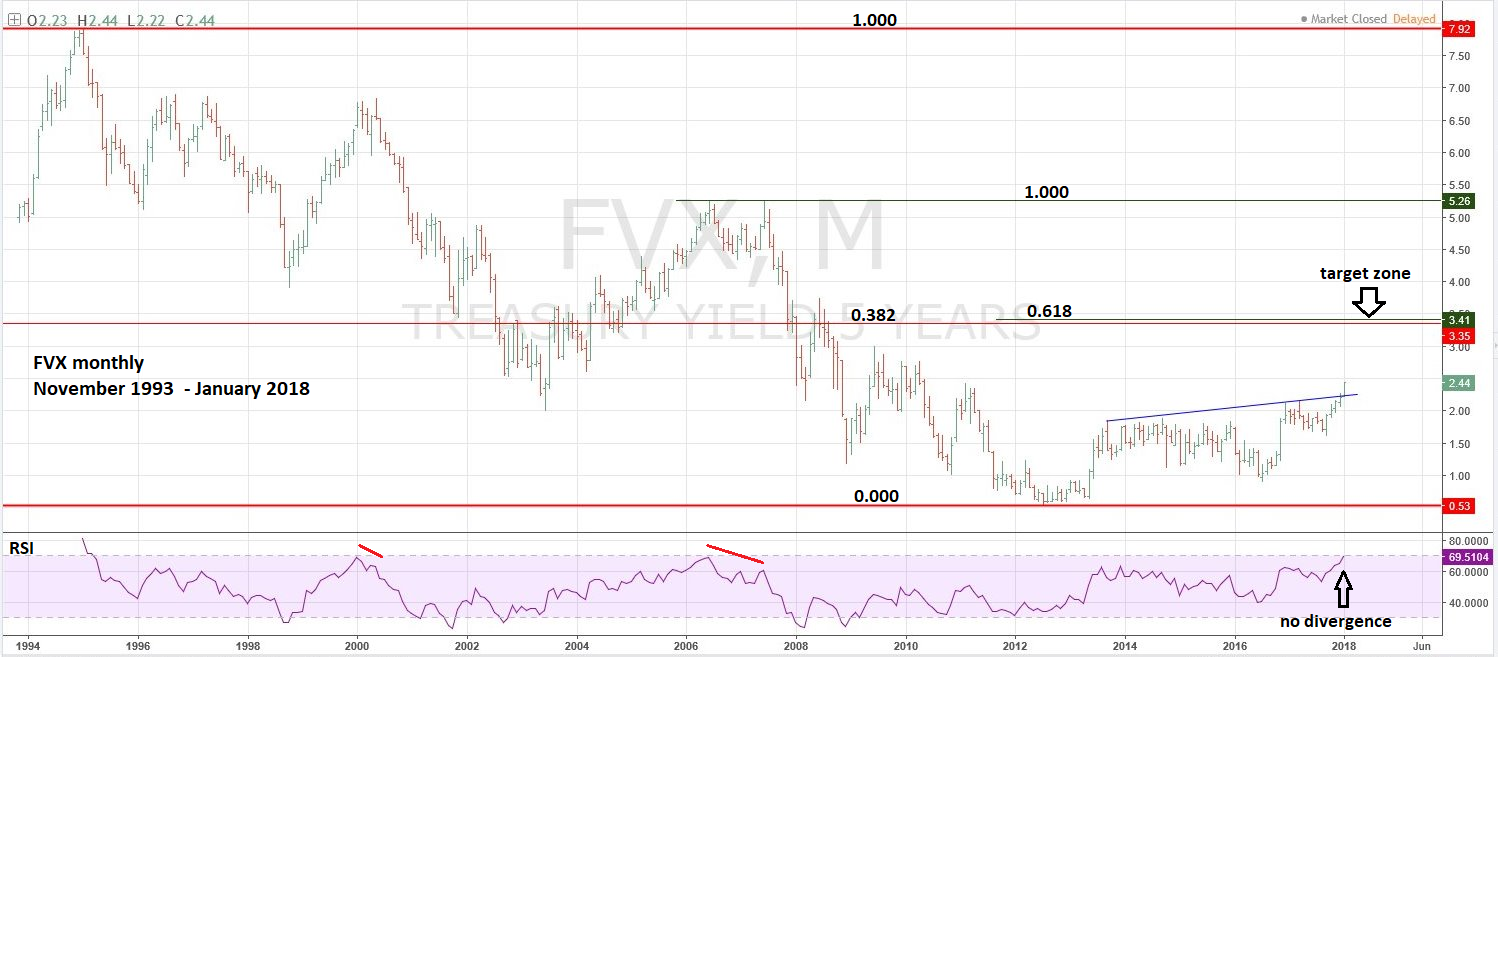
| US Treasury Five-Year Note Yield Rising interest rates are the primary reason for the decline in Utility stocks. Utility companies are capital intensive and need to have a continuous inflow of funds to maintain growth and infrastructure. Rising interest rates increase the cost of capital, therefore decreasing profits. Recently the largest relative increase for interest rates has come from the short end of the yield curve. A yield curve is a line that plots the interest rates, at a set point in time, of bonds having equal credit quality but differing maturity dates. The yields of US treasury debt obligations as of January 19, 2018 are; 90-day (IRX) 1.40%, five year (FVX) 2.44%, ten year (TNX) 2.64%, and thirty year (TYX) 2.91%. This is referred to as a rising yield curve and is what you would expect during an economic expansion. Please see the monthly US Treasury five-year note yield chart illustrated in Figure 3. Recently, FVX decisively broke above a multi-year rising trend line. Additionally, a .236 retrace of the decline from 7.93 high in 1995 to the low of .54 made in 2012 is at FVX 2.28. The current level of 2.44 is a decisive break above significant Fibonacci resistance. With breaks above two important resistance points, the door is now open for FVX to rally up to the next resistance zone. A .382 retrace of the 1995 to 2012 decline is at 3.35. A .618 retrace of the 2006 to 2012 decline is at 3.41. Later in 2018 or 2019, these two close Fibonacci coordinates are likely to act as a magnet/barrier for an FVX rally. On the shorter term FVX has had a huge rally of 50% from its bottom at 1.62 made in early September. A correction of this progress could come soon and provide a window of opportunity for the DJUA to rally. |
|
| Figure 3. Recently FVX decisively broke above a multi-year rising trend line. |
| Graphic provided by: Tradingview.com. |
| |
| Strategy And Conclusion When markets are in powerful up moves it can be difficult to establish long positions. Corrections are usually brief and shallow. The current deep oversold condition of the DJUA could be a flashing neon sign for growth hungry investors/traders. If the DJUA is in the range of 684 to 675 go long 25% Utility stocks or funds. Use DJUA 673 as a stop loss. If the DJUA does complete five waves down from the November 15 top, the subsequent rally could retrace up to 60% of the prior decline. This would be around DJUA 740. The yield curve for US treasury obligations needs to be watched closely. If later in 2018 or 2019 the shorter end of the curve continues to rise faster than the longer end, it could develop into an inverted yield curve. In this situation the shortest term 90-day yield is higher than thirty-year yield. Inverted yield curves are a recession signal. For now, the yield curve is rising implying the US economy is in expansion and that US stocks could continue to rally into at least mid-2018. Please see my January 15 article, "RSI - The Super Indicator". If the technical indicators are correct, the DJUA is currently at bargain levels and could soon be joining the party to the upside. Further Reading: Frost A.J and Robert Prechter (1985) "Elliott Wave Principle", New Classics Library. |
Independent investment advisor, trader and writer. He has written articles for Technical Analysis of Stocks & Commodities, Traders.com Advantage,Futuresmag.com and, Finance Magnates. Author of website Four Dimension Trading.
| Website: | www.fourdimensiontrading.com |
| E-mail address: | markrivest@gmail.com |
Click here for more information about our publications!
Comments
Date:�02/08/18Rank:�5Comment:�

Request Information From Our Sponsors
- StockCharts.com, Inc.
- Candle Patterns
- Candlestick Charting Explained
- Intermarket Technical Analysis
- John Murphy on Chart Analysis
- John Murphy's Chart Pattern Recognition
- John Murphy's Market Message
- MurphyExplainsMarketAnalysis-Intermarket Analysis
- MurphyExplainsMarketAnalysis-Visual Analysis
- StockCharts.com
- Technical Analysis of the Financial Markets
- The Visual Investor
- VectorVest, Inc.
- Executive Premier Workshop
- One-Day Options Course
- OptionsPro
- Retirement Income Workshop
- Sure-Fire Trading Systems (VectorVest, Inc.)
- Trading as a Business Workshop
- VectorVest 7 EOD
- VectorVest 7 RealTime/IntraDay
- VectorVest AutoTester
- VectorVest Educational Services
- VectorVest OnLine
- VectorVest Options Analyzer
- VectorVest ProGraphics v6.0
- VectorVest ProTrader 7
- VectorVest RealTime Derby Tool
- VectorVest Simulator
- VectorVest Variator
- VectorVest Watchdog