HOT TOPICS LIST
- MACD
- Fibonacci
- RSI
- Gann
- ADXR
- Stochastics
- Volume
- Triangles
- Futures
- Cycles
- Volatility
- ZIGZAG
- MESA
- Retracement
- Aroon
INDICATORS LIST
LIST OF TOPICS
PRINT THIS ARTICLE
by Mark Rivest
The RSI is giving a very reliable signal for the US stock market.
Position: N/A
Mark Rivest
Independent investment advisor, trader and writer. He has written articles for Technical Analysis of Stocks & Commodities, Traders.com Advantage,Futuresmag.com and, Finance Magnates. Author of website Four Dimension Trading.
PRINT THIS ARTICLE
RSI
RSI - The Super Indicator
01/15/18 05:25:48 PMby Mark Rivest
The RSI is giving a very reliable signal for the US stock market.
Position: N/A
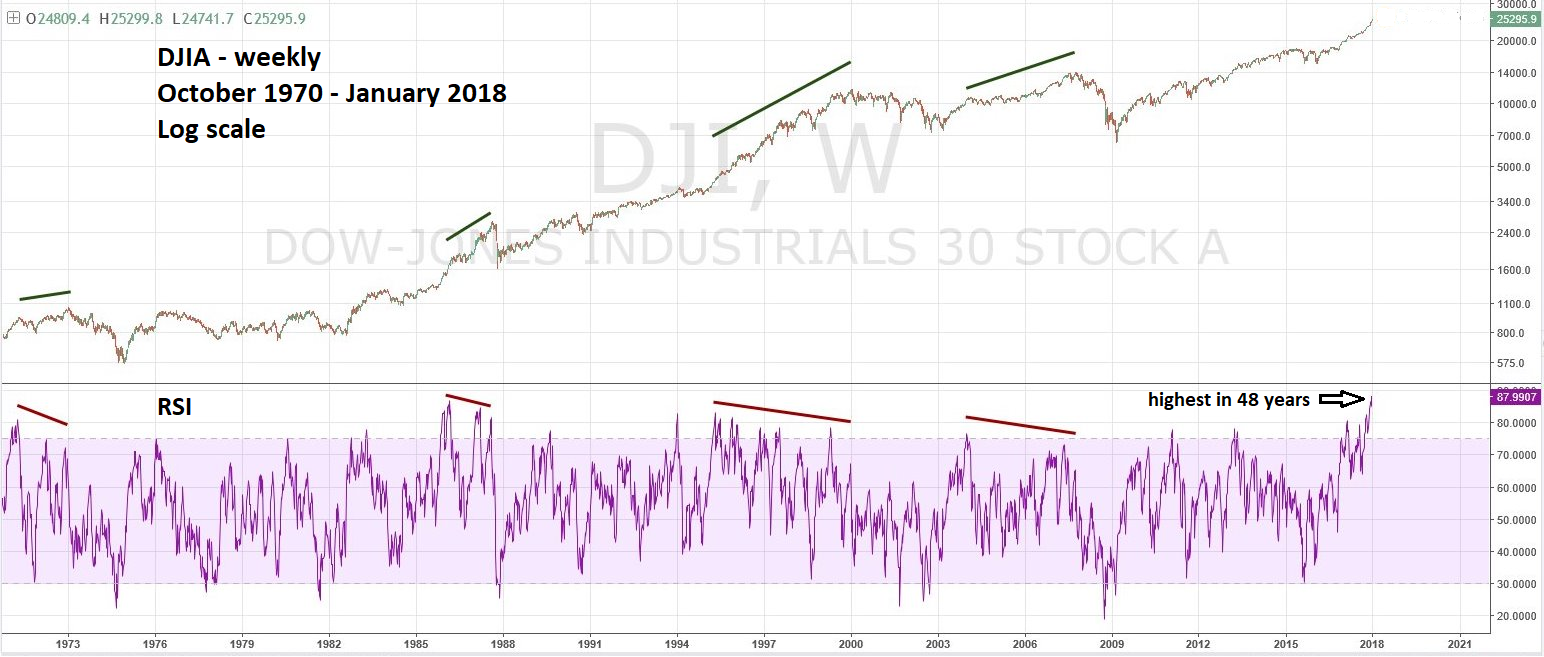
| The RSI — Relative Strength Indicator — was developed by Welles Wilder. One of its uses is to signal overbought/oversold conditions. When used with stocks or stock indices a very overbought condition is almost always bullish. Several US stock market indices currently have very overbought weekly and monthly RSI readings. See why this implies the US stock bull market could continue for several more months. Dow Jones Industrial Average - Weekly Chart Every market has its own personality. The Gold market behaves differently from the Bond market, and the Bond market behaves differently than the Corn market. The differences are caused by the fundamentals and liquidity of each market. Because of these differences, signals from technical indicators will vary from market to market. The following data about the RSI applies only to the stock market and individual stocks. It's generally believed that a very overbought RSI is a sell signal. While this could be true in other markets it is not true for the stock market or individual stocks. For information about RSI and individual stocks, please see Stella Osoba's terrific 11/22/17 article "Reading RSI Overbought/Oversold Signals" in Traders.com Advantage. These are the factors to use in determining if a very overbought RSI is bullish for a stock market index: 1) Use weekly or monthly scale. 2) Measurement begins from the last bear market bottom. 3) RSI reading is above 70% and at the highest level since the start of the bull market. Please see the weekly Dow Jones Industrial Average (DJIA) chart illustrated in Figure 1. For this illustration the DJIA bull markets are; 1970 - 1973, 1974 - 1987, 1987-2000, and 2002-2007. Also note the RSI overbought level on this chart has been raised from 70% to 75%. In all four instances the extreme overbought RSI signals only a short term or intermediate peak. The shortest time between the highest RSI reading and a major top was in the 1974-1987 bull market eighteen months. The longest time occurred between May 1995 and January 2000 a length of fifty-six months. |

|
| Figure 1. In all four instances the extreme overbought RSI signals only a short term or intermediate peak. |
| Graphic provided by: Tradingview.com. |
| |
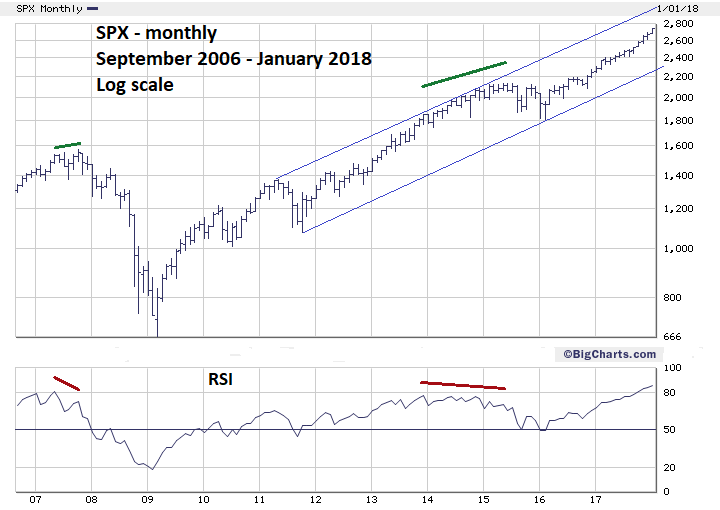
| S&P 500 - Monthly Chart Please see the monthly S&P 500 (SPX) chart illustrated in Figure 2. The scope of this chart has been reduced to just 2006-2018 for clearness. Sometimes viewing indicators on another time scale can give different signals. In this case the monthly SPX recorded its highest point in May of 2007 followed by a bearish divergence in August of 2007 — a difference of only five months before a major peak occurred. The highest RSI reading on the weekly SPX was in January of 2004, a difference of forty-three months. Note, the weekly and monthly DJIA charts have the same readings. Do extreme oversold weekly and monthly RSI readings signal continuation of bear markets? No, many times stock markets or an individual stock bear market nadir will occur with the lowest RSI reading. Does an extreme overbought RSI condition always signal continuation of a bull move? No, while it happens a very high percentage of the time, no indicator has 100% reliability. To find instances of maximum RSI readings occurring with a bull move significant peak you need to expand the scope of the data base. Going down to the five or one-minute charts can provide enough data to discover extreme RSI readings corresponding with the peaks of bullish movements. Studies have shown this phenomenon occurs about 15-20% of the time. |

|
| Figure 2. Sometimes viewing indicators on another time scale can give different signals. |
| Graphic provided by: BigCharts.com. |
| |
| Conclusion The study of weekly and monthly SPX and DJIA readings imply that US bull market in stocks could continue for a minimum of five months. If the RSI is reaching its maximum point in early January 2018, any near-term decline will probably be just another small correction. Since the February 2016 bottom, these corrections have been about 3-6%. The longest of the corrections was the August to November 2016 decline of 81 trading days. The shortest was 13 trading days in August 2017. The other three corrections ranged from 20-30 trading days. If a near term top forms in early January, a correction probably won't last beyond February and probably won't exceed support at SPX 2605. Based upon the monthly RSI history of the SPX and DJIA, the earliest a major price peak could occur would be five months after January which targets June of 2018. This is close to the usual US stock market seasonal topping zone of April-May. Additionally, Natural Gas and Crude Oil are seasonally bullish until May. Please see my January 5, 2018 article "Natural Gas Bull Market". We would all love to have a perfect market indicator that works all the time. Sorry, it doesn't exist. When it comes to markets we deal with probabilities not certainties. The history of the weekly and monthly RSI show probabilities favor US stock market bulls. If the main US stock indices make a significant peak in mid- 2018, it will be yet another example that the RSI is a super indicator. Further reading: Osoba Stella 11/22/17 "Reading RSI Overbought/Oversold Signals" Traders.com Advantage. |
Independent investment advisor, trader and writer. He has written articles for Technical Analysis of Stocks & Commodities, Traders.com Advantage,Futuresmag.com and, Finance Magnates. Author of website Four Dimension Trading.
| Website: | www.fourdimensiontrading.com |
| E-mail address: | markrivest@gmail.com |
Click here for more information about our publications!
Comments

Request Information From Our Sponsors
- StockCharts.com, Inc.
- Candle Patterns
- Candlestick Charting Explained
- Intermarket Technical Analysis
- John Murphy on Chart Analysis
- John Murphy's Chart Pattern Recognition
- John Murphy's Market Message
- MurphyExplainsMarketAnalysis-Intermarket Analysis
- MurphyExplainsMarketAnalysis-Visual Analysis
- StockCharts.com
- Technical Analysis of the Financial Markets
- The Visual Investor
- VectorVest, Inc.
- Executive Premier Workshop
- One-Day Options Course
- OptionsPro
- Retirement Income Workshop
- Sure-Fire Trading Systems (VectorVest, Inc.)
- Trading as a Business Workshop
- VectorVest 7 EOD
- VectorVest 7 RealTime/IntraDay
- VectorVest AutoTester
- VectorVest Educational Services
- VectorVest OnLine
- VectorVest Options Analyzer
- VectorVest ProGraphics v6.0
- VectorVest ProTrader 7
- VectorVest RealTime Derby Tool
- VectorVest Simulator
- VectorVest Variator
- VectorVest Watchdog
