

HOT TOPICS LIST
- MACD
- Fibonacci
- RSI
- Gann
- ADXR
- Stochastics
- Volume
- Triangles
- Futures
- Cycles
- Volatility
- ZIGZAG
- MESA
- Retracement
- Aroon
INDICATORS LIST
LIST OF TOPICS
PRINT THIS ARTICLE
by Stella Osoba, CMT
Traders often use overbought/oversold signals generated by an indicator like the Relative Strength Indicator (RSI) to place contrarian bets. But sometimes sticking with the trend is far more profitable.
Position: N/A
Stella Osoba, CMT
Stella Osoba is a trader and financial writer. She is a frequent contributor to "Technical Analysis of Stocks and Commodities" magazine and "Traders.com Advantage" as well as other financial publications.
PRINT THIS ARTICLE
RSI
Reading RSI Overbought/Oversold Signals
11/22/17 03:17:38 PMby Stella Osoba, CMT
Traders often use overbought/oversold signals generated by an indicator like the Relative Strength Indicator (RSI) to place contrarian bets. But sometimes sticking with the trend is far more profitable.
Position: N/A
| The RSI is a very popular momentum indicator. It was developed by Welles Wilder and one of its uses is to signal overbought/oversold conditions in a security. A security is overbought when it has risen too far too fast. This is often considered to be a warning that the security will soon correct by falling. A security is oversold when it has dropped too far too fast, and this is often considered to be a warning that it will soon rise. Watching for these conditions, traders will sometimes place a contrarian bet in the hopes of profiting when the stock rises or falls. |
| The default values of the RSI are 14 days and the default levels for the RSI are 70 and 30. The security is considered overbought if it rises above 70 and oversold if it falls below 30. These are not fixed levels and should be adjusted depending on the behavior of the security you are watching. For this article, we will use the default values to illustrate an important point about the dangers of a mechanical use of overbought and oversold levels. |
|
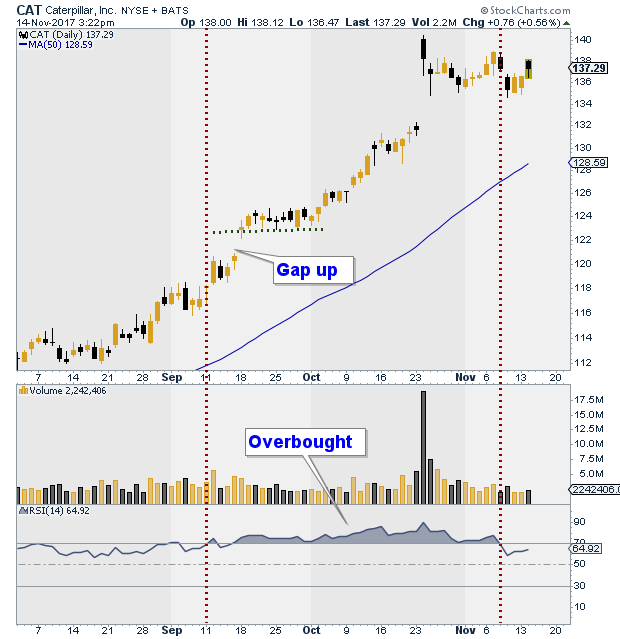
| Figure 1. Daily chart for CAT with RSI Indicator. |
| Graphic provided by: StockCharts.com. |
| |
| Caterpillar, Inc. (CAT) had been above its 50-day moving average since April 2017 (not shown). In early September CAT moved above 70 and into traditional overbought territory (See first red dotted vertical line on chart). But because the preceding uptrend was very strong, it would have been the wrong action to short the stock in the hopes of an imminent reversal. In fact, that would have led to heavy losses, because as we can see from the chart, the stock stayed in overbought conditions and continued to move higher until early November. |
| When using technical analysis, mechanical rules will often fail. The trick is to weigh all of the evidence before you and interpret the signals that you are seeing based on what that particular security is doing and not on what is supposed to happen. In this case, CAT was in a strong uptrend when it moved into overbought territory. The gap up on September 18 was further evidence of the strength of the prevailing trend. As far as the chart was concerned, there was no reason to short the stock because the uptrend showed continuing strength. It was not in trouble. After the gap up, the stock moved sideways for two weeks (see green dotted horizontal line on chart) and then resumed its upwards climb. |
| This is a good example of why overbought or oversold signals should always be weighed very carefully before deciding to use them as a contrarian indicator. When the bulk of the evidence shows that the trend is very strong, it is often the case that the best trade will be in the direction of the trend and not against it, irrespective of the RSI showing overbought/oversold signals. And as CAT has shown, a security can stay at overbought or oversold levels for a considerable amount of time. |
Stella Osoba is a trader and financial writer. She is a frequent contributor to "Technical Analysis of Stocks and Commodities" magazine and "Traders.com Advantage" as well as other financial publications.
| E-mail address: | stellaosoba@gmail.com |
Click here for more information about our publications!
Comments
Date:�11/23/17Rank:�4Comment:�
Date:�11/17/19Rank:�5Comment:�

Request Information From Our Sponsors
- StockCharts.com, Inc.
- Candle Patterns
- Candlestick Charting Explained
- Intermarket Technical Analysis
- John Murphy on Chart Analysis
- John Murphy's Chart Pattern Recognition
- John Murphy's Market Message
- MurphyExplainsMarketAnalysis-Intermarket Analysis
- MurphyExplainsMarketAnalysis-Visual Analysis
- StockCharts.com
- Technical Analysis of the Financial Markets
- The Visual Investor
- VectorVest, Inc.
- Executive Premier Workshop
- One-Day Options Course
- OptionsPro
- Retirement Income Workshop
- Sure-Fire Trading Systems (VectorVest, Inc.)
- Trading as a Business Workshop
- VectorVest 7 EOD
- VectorVest 7 RealTime/IntraDay
- VectorVest AutoTester
- VectorVest Educational Services
- VectorVest OnLine
- VectorVest Options Analyzer
- VectorVest ProGraphics v6.0
- VectorVest ProTrader 7
- VectorVest RealTime Derby Tool
- VectorVest Simulator
- VectorVest Variator
- VectorVest Watchdog