

HOT TOPICS LIST
- MACD
- Fibonacci
- RSI
- Gann
- ADXR
- Stochastics
- Volume
- Triangles
- Futures
- Cycles
- Volatility
- ZIGZAG
- MESA
- Retracement
- Aroon
INDICATORS LIST
LIST OF TOPICS
PRINT THIS ARTICLE
by Mark Rivest
See why a Natural Gas bull market could affect Crude Oil and the US stock market.
Position: N/A
Mark Rivest
Independent investment advisor, trader and writer. He has written articles for Technical Analysis of Stocks & Commodities, Traders.com Advantage,Futuresmag.com and, Finance Magnates. Author of website Four Dimension Trading.
PRINT THIS ARTICLE
SEASONAL TRADING
Natural Gas Bull Market
01/05/18 04:18:30 PMby Mark Rivest
See why a Natural Gas bull market could affect Crude Oil and the US stock market.
Position: N/A
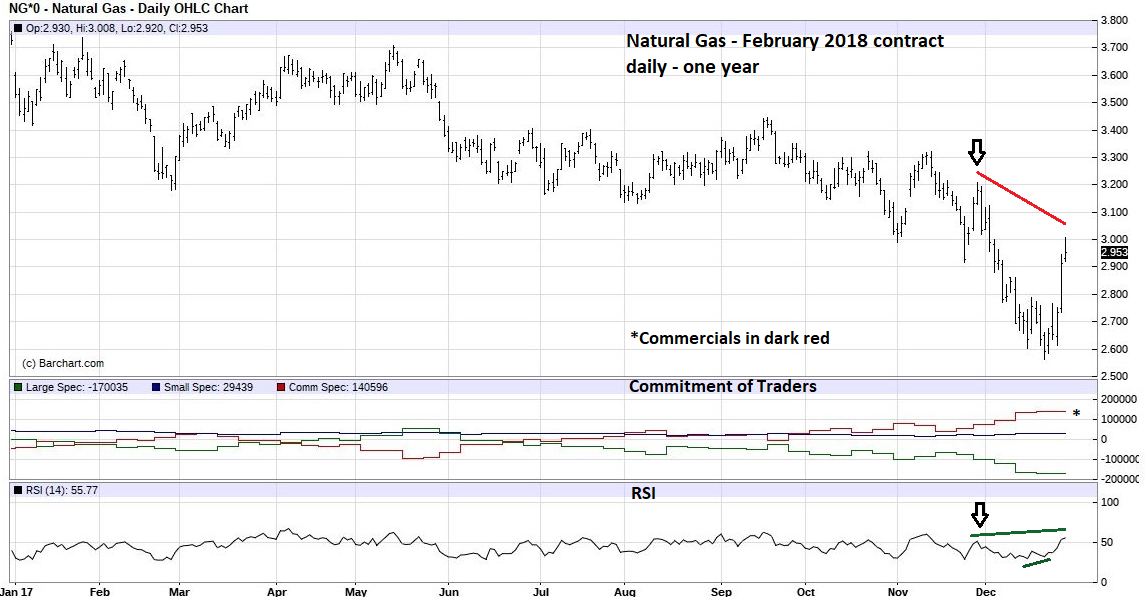
| On December 21, 2017, Winter solstice, Natural Gas-February 2018 futures contract (NGG18) reached the lowest point of its nearly one-year long decline, bottoming at 2.562. Then in just six trading days rallied to a high of 3.008 and closed 2017 at 2.953. The sharp rise is being attributed to severe cold weather in the US. In the short term this is probably true, however all four market dimensions, Price, Time, Sentiment, and Momentum, indicate a larger bull move has just begun. Natural Gas - Sentiment and Momentum Please see the daily Natural Gas chart illustrated in Figure 1. The Commitment of Traders report splits futures traders into three groups: Large Speculators, Small Speculators, and Commercials. The Commercials have the most futures contracts; this is the big money group you want to follow. Typically, large net long holdings by the Commercials will correspond to a significant bottom. Large net short holdings occur near significant tops. At the exact time Natural Gas was making a bottom, the Commercials had their highest net long position since March of 2016. The last time Commercials had a larger net long position was in February 2016, which was the beginning of a nearly one-year bull market. On the weekly Natural Gas futures chart this rally went from 1.61 to 3.902 and peaked in December 2016. Daily momentum is bullish. In addition to the December 21 bullish RSI divergence with the bottom made on December 15, note that the December 29 reading is higher than the RSI recorded at the November 29 short term high at 3.21. This implies NGG18 could rise very soon to at least 3.21. |
|
| Figure 1. At the exact time Natural Gas was making a bottom, the Commercial had their highest net long position since March of 2016. |
| Graphic provided by: Barcharts.com. |
| |
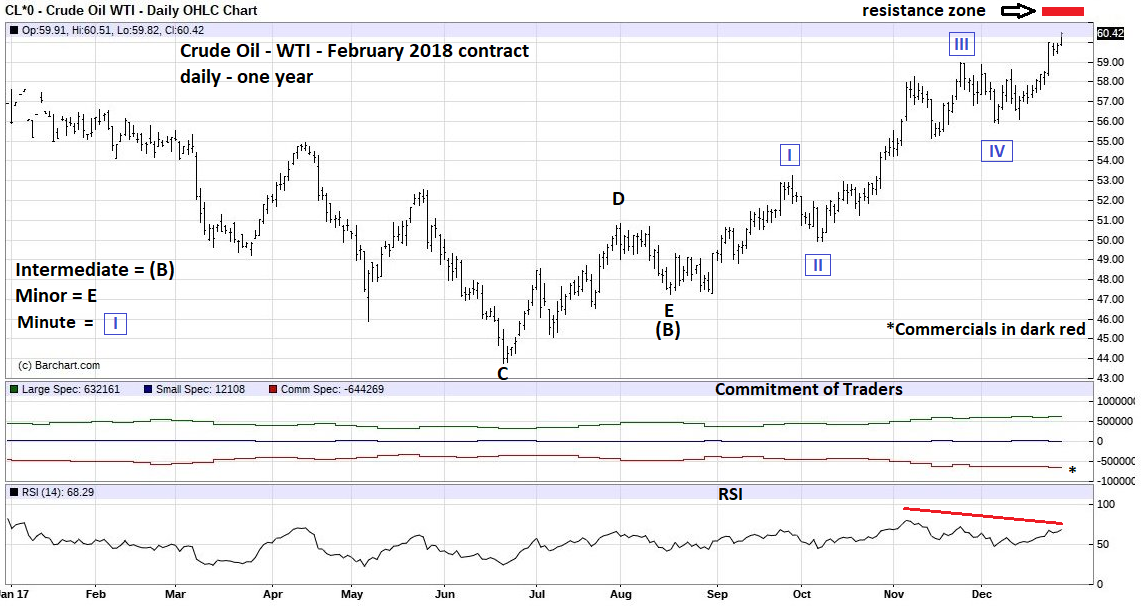
| Crude Oil - Sentiment, and Price Please see the daily Crude Oil chart illustrated in Figure 2. My December 1, 2017 article "Crude Oil Barrier" noted that an important Crude Oil peak could be imminent with powerful resistance around 60.90 to 62.10. The specific Fibonacci points based upon the weekly Crude Oil futures chart are 61.41 and 61.63. On December 29, 2017, February 2018-Crude Oil (CLG18) reached 60.51 and closed at 60.42. Two factors suggest if Crude Oil reaches the resistance zone 60.90 to 62.10 it could only be a temporary top, prior to higher levels later in 2018. The December 1 article was written in late November and it appeared that Crude Oil could reach the resistance zone in just a few trading days, then decline into the seasonal bottoming time of late December. Crude Oil didn't reach the resistance zone and the early December decline was shallow. Seasonal patterns are now bullish until May, with February and March strongly bullish. Natural Gas and Crude Oil tend to trade together, so if a new bull market has begun in Natural Gas it could at least drag Crude Oil higher. But what about the very high net short position the Commercials have taken on Crude Oil? As noted in the December 1 article, Commercials had their largest net short position in twenty years. The Commercials are the smart money, they are not the infallible money. On rare occasions the Commercials in several futures markets have been wrong in a big way. If Crude Oil is in a bull market that can extend well into 2018 here are two scenarios that could happen: 1) The resistance zone at 60.90-62.10 holds and Crude Oil declines for about two to three weeks, allowing the Commercials to reduce their short positions prior to the next rally. 2) Resistance zone doesn't hold, and the Commercials are forced to reduce their short positions in a relentless multi-month rally. |
|
| Figure 2. Seasonal patterns are now bullish until May, with February and March strongly bullish. |
| Graphic provided by: Barcharts.com. |
| |
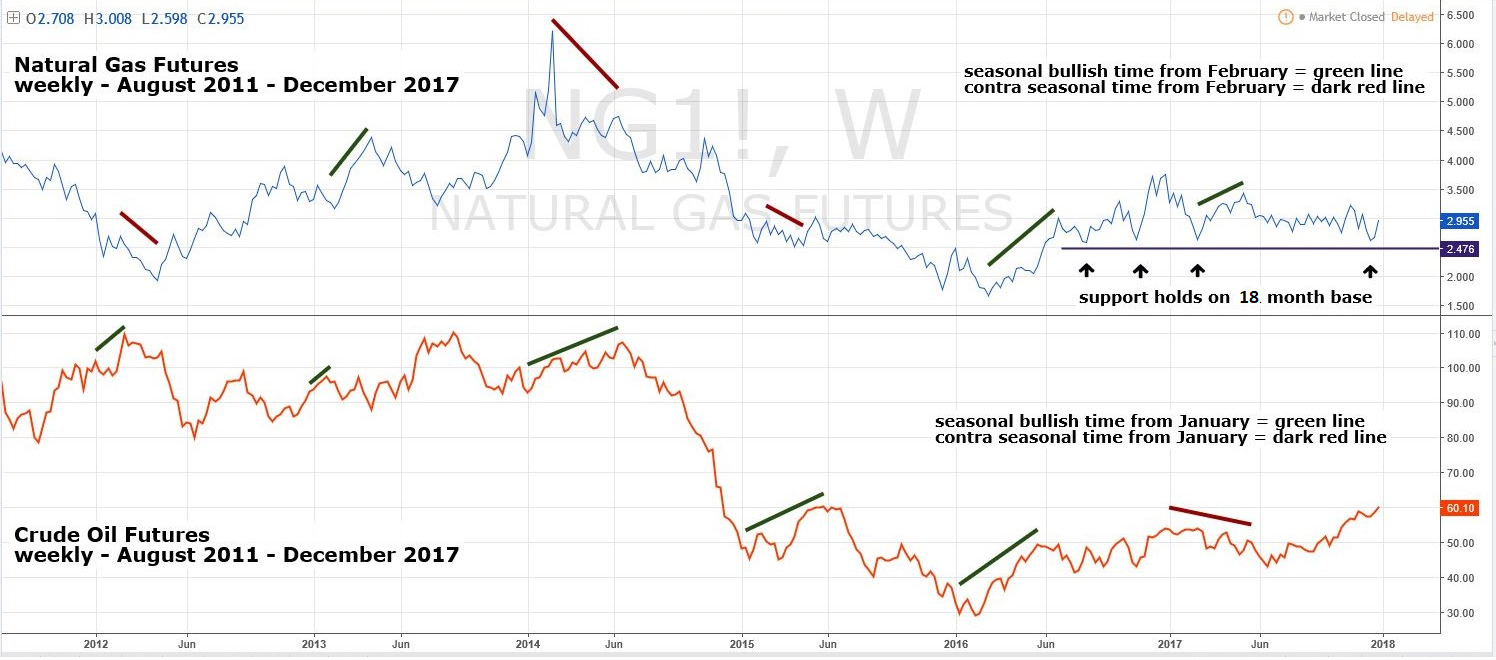
| Weekly Natural Gas and Crude Oil Please see the weekly Natural Gas and Crude Oil chart illustrated in Figure 3. This chart shows both commodities generally trade in the same direction, with one at times outperforming the other. Over the last six years Crude Oil has the stronger seasonal tendency. The weekly Natural Gas chart shows how support was found four times in the 2.50 area. Entering January 2018-Crude Oil's Sentiment dimension is bearish because of the Commercials high net short position. The Time dimension is bullish because of its very reliable seasonal record. Natural Gas Sentiment dimension is bullish because of the Commercials high net long position. The Time dimension is neutral because of a less reliable seasonal record. The deciding factor for which commodity to trade comes from the Price dimension. Natural Gas has moved above clear support in the 2.50 area. Crude Oil has potential resistance in the 61.00 area. This so far is still only theoretical because price has yet to reject the Fibonacci resistance. The weight of evidence favors traders entering long positions in Natural Gas, which could reach the 3.90 area by May of 2018. |
|
| Figure 3. Natural Gas has moved above clear support in the 2.50 area. |
| Graphic provided by: Tradingview.com. |
| |
| Stock Market Update One factor for rising Crude Oil and Natural Gas could be increased economic activity. If so, it also implies rising stock prices. My December 21 article "The Profit Triangle" noted on December 15 the S&P 500 (SPX) may have completed an Elliott wave Ending Diagonal Triangle (EDT). The next trading day the SPX made a new all-time high at 2694.97, the EDT count is invalid at 2699.24. While still theoretically possible, the EDT count is doubtful because of the wide breech of the triangle's upper trendline. Additionally, post EDT reversals are usually very rapid. Eight trading days after the SPX all-time high the decline has been very shallow. At the dawn of 2018 it appears the SPX is just in another brief correction before the bull market resumes. US stock market seasonal patterns are bullish until at least April, which ties in with the seasonal patterns for Crude Oil and Natural Gas. Cancel the recommendation to short stocks if the SPX breaks below 2544.00. The first week of 2018 could provide important clues as to the bull market termination date. More about that later. Have a Happy New Year! Further reading: Frost A.J and Robert Prechter (1985) "Elliott Wave Principle", New Classics Library. |
Independent investment advisor, trader and writer. He has written articles for Technical Analysis of Stocks & Commodities, Traders.com Advantage,Futuresmag.com and, Finance Magnates. Author of website Four Dimension Trading.
| Website: | www.fourdimensiontrading.com |
| E-mail address: | markrivest@gmail.com |
Click here for more information about our publications!
PRINT THIS ARTICLE

Request Information From Our Sponsors
- VectorVest, Inc.
- Executive Premier Workshop
- One-Day Options Course
- OptionsPro
- Retirement Income Workshop
- Sure-Fire Trading Systems (VectorVest, Inc.)
- Trading as a Business Workshop
- VectorVest 7 EOD
- VectorVest 7 RealTime/IntraDay
- VectorVest AutoTester
- VectorVest Educational Services
- VectorVest OnLine
- VectorVest Options Analyzer
- VectorVest ProGraphics v6.0
- VectorVest ProTrader 7
- VectorVest RealTime Derby Tool
- VectorVest Simulator
- VectorVest Variator
- VectorVest Watchdog
- StockCharts.com, Inc.
- Candle Patterns
- Candlestick Charting Explained
- Intermarket Technical Analysis
- John Murphy on Chart Analysis
- John Murphy's Chart Pattern Recognition
- John Murphy's Market Message
- MurphyExplainsMarketAnalysis-Intermarket Analysis
- MurphyExplainsMarketAnalysis-Visual Analysis
- StockCharts.com
- Technical Analysis of the Financial Markets
- The Visual Investor