HOT TOPICS LIST
- MACD
- Fibonacci
- RSI
- Gann
- ADXR
- Stochastics
- Volume
- Triangles
- Futures
- Cycles
- Volatility
- ZIGZAG
- MESA
- Retracement
- Aroon
INDICATORS LIST
LIST OF TOPICS
PRINT THIS ARTICLE
by Mark Rivest
How to discover and profit from a very reliable Elliott wave pattern.
Position: N/A
Mark Rivest
Independent investment advisor, trader and writer. He has written articles for Technical Analysis of Stocks & Commodities, Traders.com Advantage,Futuresmag.com and, Finance Magnates. Author of website Four Dimension Trading.
PRINT THIS ARTICLE
ELLIOTT WAVE
The Profit Triangle
12/21/17 04:29:16 PMby Mark Rivest
How to discover and profit from a very reliable Elliott wave pattern.
Position: N/A
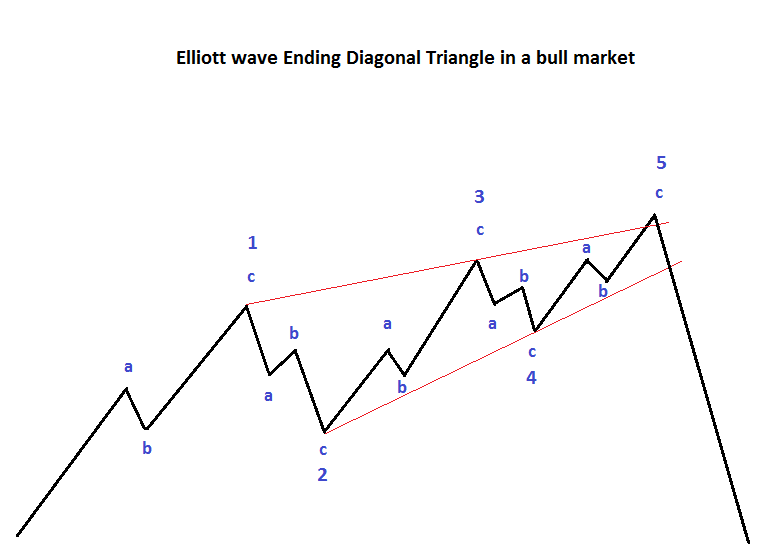
| If you were to ask any practitioner of the Elliott Wave Theory what they thought was the most reliable pattern — the probable response would be, Ending Diagonal Triangle (EDT). The reason, there are several factors that make an EDT very distinctive and easy to recognize. When an EDT is complete it can usually predict with a high probability a market's next turn. During the first half of December 2017, the S&P 500 (SPX) has formed what appears to be a completed EDT. If so, this pattern could help to predict the US stock markets direction for the remainder of December and beyond. Text Book Ending Diagonal Triangle Please see the chart — Ending Diagonal Triangle in a bull market illustrated in Figure 1. EDTs form in either the fifth wave position or sometimes in wave "C" of a corrective pattern. They usually appear in the later portion of and extended move. EDTs represent exhaustion of the next larger Elliott wave structure. They take a wedge shape within two converging lines. It's theoretically possible an EDT could take an expanding shape with diverging lines. If this structure exists, it is extremely rare. Each of the five sub waves of an EDT, including waves 1, 3, and 5 subdivide into a three-wave pattern. Almost always, wave four overlaps into the territory of wave one. Caution, the key word in the prior sentence is "almost". On occasion you will discover an EDT where wave four does not overlap wave one. Most of the time wave three of an EDT is shorter than wave one. Many EDT's will end with a throw over of the trend line that connects the termination points of waves one and three. This throw over is usually brief and marginal. Too much time beyond the trend line can aid in discovering if the EDT is invalid. Also, the third wave of any motive pattern can never be the shortest. Since most of the time the third wave of an EDT is shorter than wave one, if the fifth wave a supposed EDT is longer than wave three and wave three is shorter than one, the EDT pattern would be invalid. |

|
| Figure 1. EDTs form in either the fifth wave position or sometimes in wave "C" of a corrective pattern. |
| Graphic provided by: Mark Rivest. |
| |
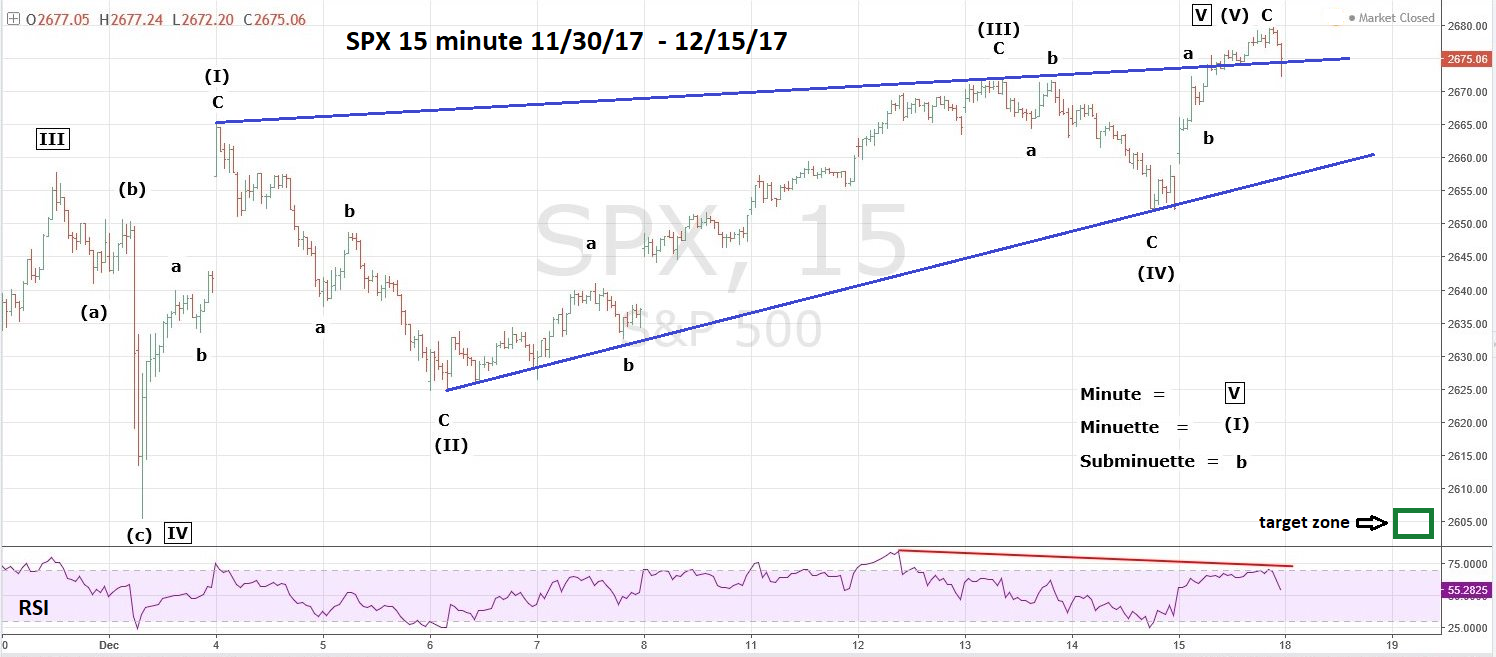
| S&P 500 - 15-Minute Chart Please see the SPX - 15-minute chart illustrated in Figure 2. The SPX from the bottom made on December 1 has formed a wedge in which the supposed Minuette wave (IV) is overlapping into the territory of the supposed Minuette wave one. Minuette wave (V) also has a throw over of the upper trend line connecting the ends of waves (I) and (III). Minuette wave (I) has a distinctive three-wave sub division, the same can't be said of the supposed waves (III) and (V). In a situation where there's doubt about the pattern, Fibonacci analysis can provide valuable clues. Typically wave four will retrace .382 of wave three. In this case a .382 retrace of wave (III) targets SPX 2053.88. Wave fours also have a Fibonacci relationship with wave twos. Wave (II) length was 40.44 multiplied by the Fibonacci ratio of .50 equals 20.22. Subtracting 20.22 from the wave (III) peak of 2671.88 targets SPX 2051.61. The supposed wave (IV) found support at 2052.10, in between the two very close Fibonacci coordinates. On December 15, soon after the marginal break above the upper trend line the SPX had a rapid decline back below the trend line. This late day move strongly suggests the EDT is complete. An SPX move above the all-time high at 2679.63 on December 18 would put the EDT count in doubt. Because wave (III) of this EDT count is shorter than wave (I), if the SPX moves above 2699.23 the EDT count would be eliminated. At 2699.24 the supposed wave (V) would be longer than wave (III) - an Elliott wave rule violation. After completion of an EDT, the subsequent reversal usually finds support/resistance at the EDT point of origin. Which in this case is SPX 2605. In both bull and bear markets the subsequent EDT reversals are usually very rapid. The eleven-trading day EDT could be completely retraced in just three to five trading days. |

|
| Figure 2. After completion of an EDT, the subsequent reversal usually finds support/resistance at the EDT point of origin. |
| Graphic provided by: Tradingview.com. |
| |
| Big Picture And Strategy If the EDT is complete could it mark the termination point of the entire bull move from early 2016? Unlikely, because the SPX weekly RSI on December 15 was at 83.43% — the highest recording since the bull market began in 2009. As noted in my December 14 article "Nikkei Deflection Point" if a stock index is making a rally high accompanied by an RSI high, there's at least an 80% probability of still higher prices. It will take at least one weekly decline followed by an advance to a new all-time high to record a weekly RSI bearish divergence. It's possible this could happen at the end of 2017. More about this in a future article if necessary. Short 25% stock if the SPX breaks below 2544.00 and use the SPX all-time high as a stop loss. Further Reading: Frost A.J and Robert Prechter (1985) "Elliott Wave Principle", New Classics Library. |
Independent investment advisor, trader and writer. He has written articles for Technical Analysis of Stocks & Commodities, Traders.com Advantage,Futuresmag.com and, Finance Magnates. Author of website Four Dimension Trading.
| Website: | www.fourdimensiontrading.com |
| E-mail address: | markrivest@gmail.com |
Click here for more information about our publications!
PRINT THIS ARTICLE

Request Information From Our Sponsors
- StockCharts.com, Inc.
- Candle Patterns
- Candlestick Charting Explained
- Intermarket Technical Analysis
- John Murphy on Chart Analysis
- John Murphy's Chart Pattern Recognition
- John Murphy's Market Message
- MurphyExplainsMarketAnalysis-Intermarket Analysis
- MurphyExplainsMarketAnalysis-Visual Analysis
- StockCharts.com
- Technical Analysis of the Financial Markets
- The Visual Investor
- VectorVest, Inc.
- Executive Premier Workshop
- One-Day Options Course
- OptionsPro
- Retirement Income Workshop
- Sure-Fire Trading Systems (VectorVest, Inc.)
- Trading as a Business Workshop
- VectorVest 7 EOD
- VectorVest 7 RealTime/IntraDay
- VectorVest AutoTester
- VectorVest Educational Services
- VectorVest OnLine
- VectorVest Options Analyzer
- VectorVest ProGraphics v6.0
- VectorVest ProTrader 7
- VectorVest RealTime Derby Tool
- VectorVest Simulator
- VectorVest Variator
- VectorVest Watchdog
