

HOT TOPICS LIST
- MACD
- Fibonacci
- RSI
- Gann
- ADXR
- Stochastics
- Volume
- Triangles
- Futures
- Cycles
- Volatility
- ZIGZAG
- MESA
- Retracement
- Aroon
INDICATORS LIST
LIST OF TOPICS
PRINT THIS ARTICLE
by Mark Rivest
Elliott wave patterns and RSI momentum could signal an approaching Nikkei top.
Position: N/A
Mark Rivest
Independent investment advisor, trader and writer. He has written articles for Technical Analysis of Stocks & Commodities, Traders.com Advantage,Futuresmag.com and, Finance Magnates. Author of website Four Dimension Trading.
PRINT THIS ARTICLE
ELLIOTT WAVE
Nikkei Deflection Point
12/14/17 03:57:25 PMby Mark Rivest
Elliott wave patterns and RSI momentum could signal an approaching Nikkei top.
Position: N/A
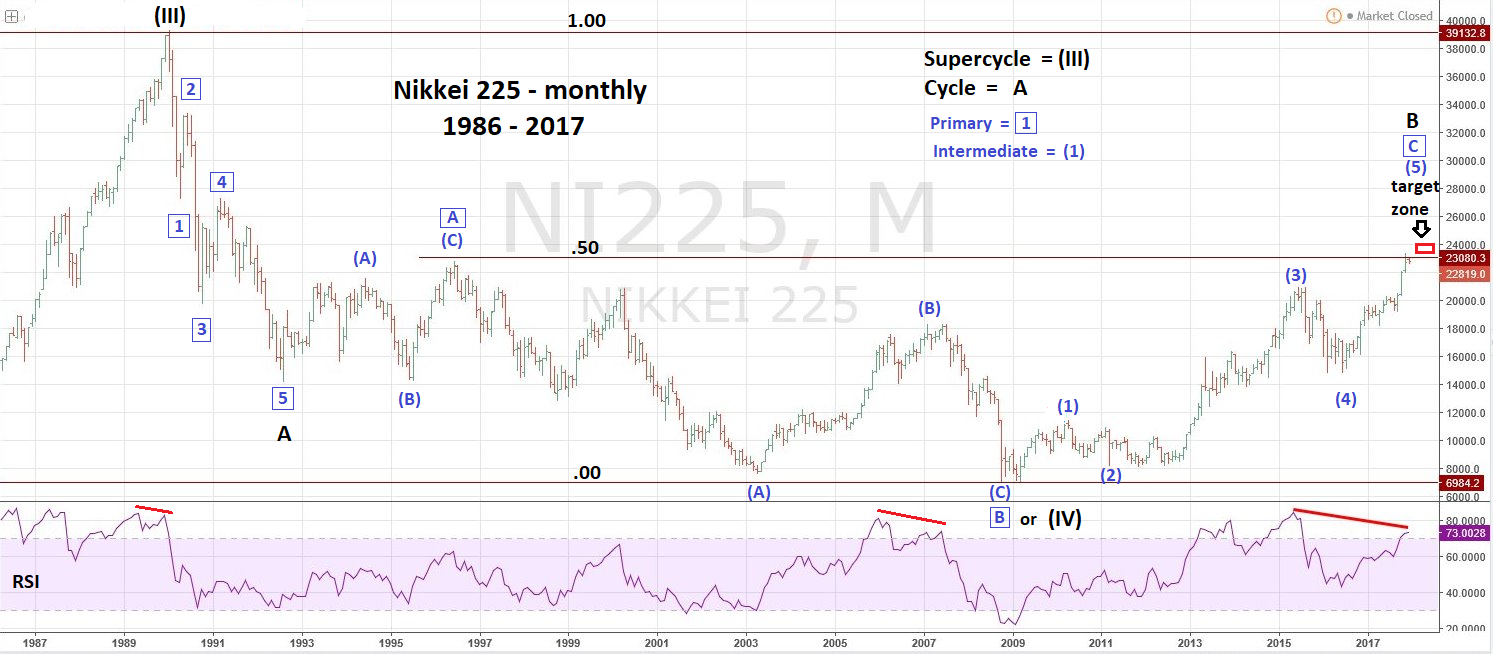
| The Nikkei 225 (NI225) has been one of the strongest stock markets in the world since the last significant bottom made in early 2016. Since then the NI225 is up 53% vs. the S&P 500 (SPX) 46% and in 2017 up 19% vs. the SPX 17% rally. The bullish trend could end sometime in December as both long and short-term Elliott wave patterns are nearing completion. Nikkei Monthly Please see the monthly NI225 chart illustrated in Figure 1. The NI225 could be completing an Elliott wave Expanding Flat that began twenty-five years ago! An Expanding Flat's initial rally sub-divides in to three waves. Followed by a three wave decline that exceeds the low of the initial rally. The final phase is a five-wave rally that exceeds the termination point of the initial rally. An equally acceptable alternative count has the NI225 bear market complete at the major bottom made in 2009. Since both the first wave up of a bull market and wave "C" wave of an Expanding Flat take the form of five waves, the message is the same — big downside risk. If the first wave up of a new bull market is nearing completion it implies a decline in proportion to the prior eight-year bull market. Significant support is near 15,000, a 35% decline. If the colossal bear market from 1990 is still in effect it implies a breach of the major bottom at 6,994.90. Fibonacci analysis indicates a narrow window where a significant peak may occur. Recently the NI225 has marginally exceeded a 50% retrace of the entire bear market from 1990 to 2009. Additionally, the high of the supposed Primary wave "A - boxed" at 22,750 has been exceeded, which is a necessary ingredient for an Expanding Flat. Within a five-wave structure, wave "one" usually has a Fibonacci relationship with wave "five". From the bottom made at 6,994.90, intermediate wave (1) is 4,413.30 x 2 equals 8,826.60 added to the intermediate wave (4) bottom of 14,864.00 targets 23,690.60 — not far from the 2017 high of 23,382.20. |
|
| Figure 1. The NI225 could be completing an Elliott wave Expanding Flat that began twenty-five years ago! |
| Graphic provided by: Tradingview.com. |
| |
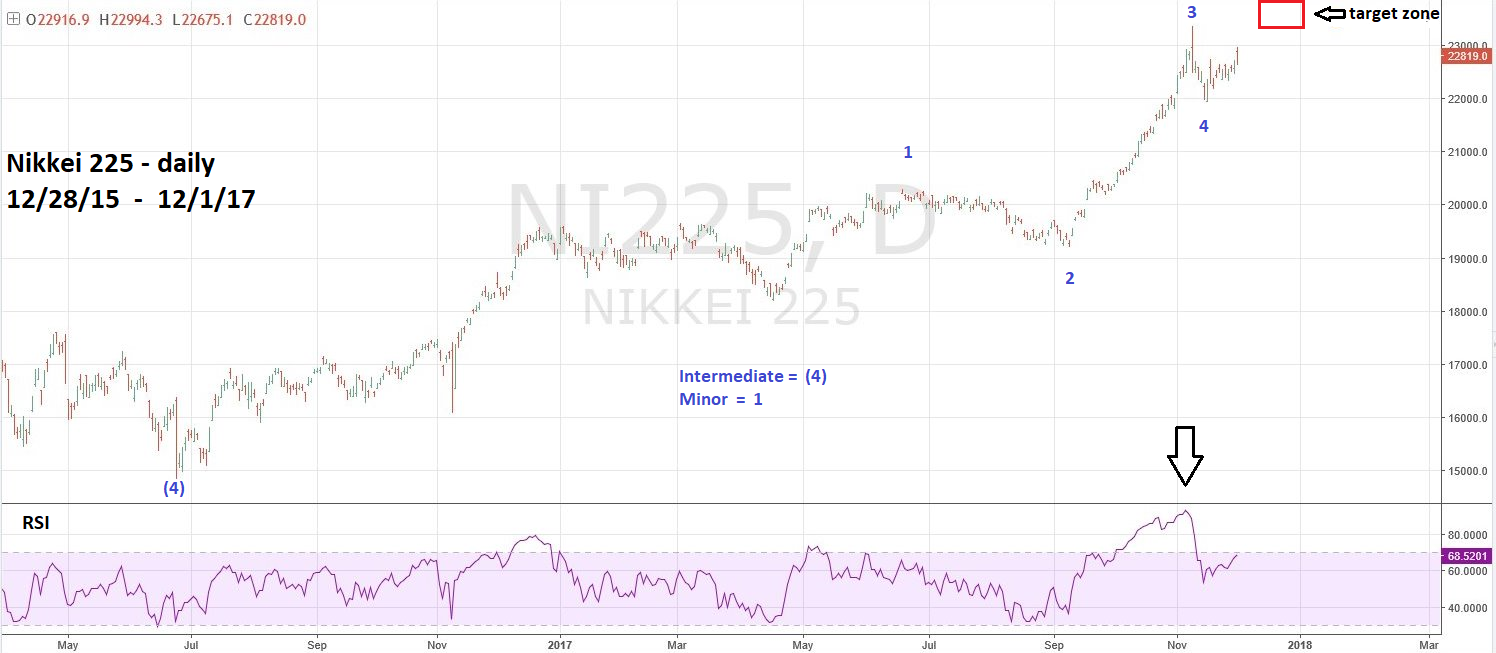
| Nikkei Daily Please see the daily NI225 chart illustrated in Figure 2. During a stock bull market, RSI is the best predictive indicator. If a stock index is making a rally high accompanied by a high RSI reading, there's at least an 80% probability of still higher prices. Note on the monthly chart the peaks made in 1989 and 2006 were later eclipsed by higher prices with RSI bearish divergences. Note on the daily chart the recent price peak had a very high RSI reading. There's about an 80% chance this price high will soon be exceed with what could be a significant RSI divergence. If the NI225 reaches the Fibonacci target zone with a RSI bearish divergence, a significant top could be forming. The strongest signals come when the monthly, weekly, and daily RSI all have bearish divergences. So far, the NI225 has bearish RSI divergences on the monthly and weekly scale. |
|
| Figure 2. During a stock bull market, RSI is the best predictive indicator. |
| Graphic provided by: Tradingview.com. |
| |
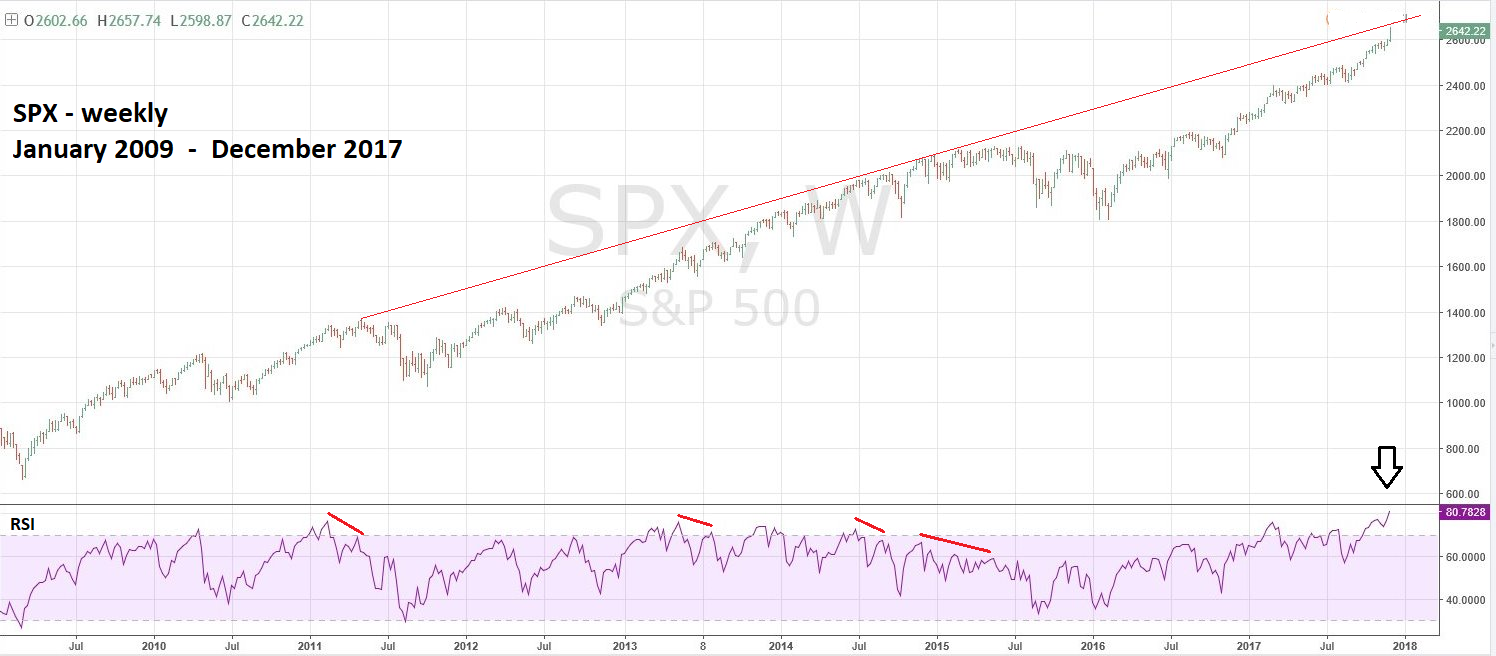
| S&P 500 Weekly Please see the weekly SPX chart illustrated in Figure 3. The recent SPX all-time high was accompanied by the highest weekly RSI reading since the bull market began in March 2009. The monthly SPX RSI also has the highest reading since the start of the bull market. Only the daily RSI has a bearish divergence. US stock market seasonal patterns are bullish until April combined with bullish RSI readings, indicate a high probability the US stock market will continue to rise. At a minimum it would require a decline of two weeks followed by a rally of at least one week for the weekly SPX to have a bearish divergence. This targets late December as the earliest time for a significant SPX top. Sometimes markets can have significant turns on the cusp of a new year. More about this in a future article if necessary. |
|
| Figure 3. The recent SPX all-time high was accompanied by the highest weekly RSI reading since the bull market began in March 2009. |
| Graphic provided by: Tradingview.com. |
| |
| Summary and Strategy If the NI225 reaches the target zone of 23,383 to 24,000 and subsequently moves down, a significant peak could be forming. A move above 24,000 will open the door for the NI225 to reach 26,935 which is a .618 retrace of the 1990 to 2009 bear market. Because the NI225 has been outperforming the SPX since early 2016 a NI225 decline will most likely be accompanied by an SPX decline. Watch for a daily NI225 RSI bearish divergence and a weekly SPX, especially if this occurs near the end of the year. Short 25% stocks if the SPX breaks below 2544.00 and use the SPX all-time high as a stop loss. Further reading: Frost A.J and Robert Prechter (1985) "Elliott Wave Principle", New Classics Library. |
Independent investment advisor, trader and writer. He has written articles for Technical Analysis of Stocks & Commodities, Traders.com Advantage,Futuresmag.com and, Finance Magnates. Author of website Four Dimension Trading.
| Website: | www.fourdimensiontrading.com |
| E-mail address: | markrivest@gmail.com |
Click here for more information about our publications!
PRINT THIS ARTICLE

Request Information From Our Sponsors
- StockCharts.com, Inc.
- Candle Patterns
- Candlestick Charting Explained
- Intermarket Technical Analysis
- John Murphy on Chart Analysis
- John Murphy's Chart Pattern Recognition
- John Murphy's Market Message
- MurphyExplainsMarketAnalysis-Intermarket Analysis
- MurphyExplainsMarketAnalysis-Visual Analysis
- StockCharts.com
- Technical Analysis of the Financial Markets
- The Visual Investor
- VectorVest, Inc.
- Executive Premier Workshop
- One-Day Options Course
- OptionsPro
- Retirement Income Workshop
- Sure-Fire Trading Systems (VectorVest, Inc.)
- Trading as a Business Workshop
- VectorVest 7 EOD
- VectorVest 7 RealTime/IntraDay
- VectorVest AutoTester
- VectorVest Educational Services
- VectorVest OnLine
- VectorVest Options Analyzer
- VectorVest ProGraphics v6.0
- VectorVest ProTrader 7
- VectorVest RealTime Derby Tool
- VectorVest Simulator
- VectorVest Variator
- VectorVest Watchdog