

HOT TOPICS LIST
- MACD
- Fibonacci
- RSI
- Gann
- ADXR
- Stochastics
- Volume
- Triangles
- Futures
- Cycles
- Volatility
- ZIGZAG
- MESA
- Retracement
- Aroon
INDICATORS LIST
LIST OF TOPICS
PRINT THIS ARTICLE
by Mark Rivest
See why Price, Time, Sentiment, and Momentum dimensions indicate Crude Oil is near significant resistance.
Position: N/A
Mark Rivest
Independent investment advisor, trader and writer. He has written articles for Technical Analysis of Stocks & Commodities, Traders.com Advantage,Futuresmag.com and, Finance Magnates. Author of website Four Dimension Trading.
PRINT THIS ARTICLE
FIBONACCI
Crude Oil Barrier
12/01/17 04:17:11 PMby Mark Rivest
See why Price, Time, Sentiment, and Momentum dimensions indicate Crude Oil is near significant resistance.
Position: N/A
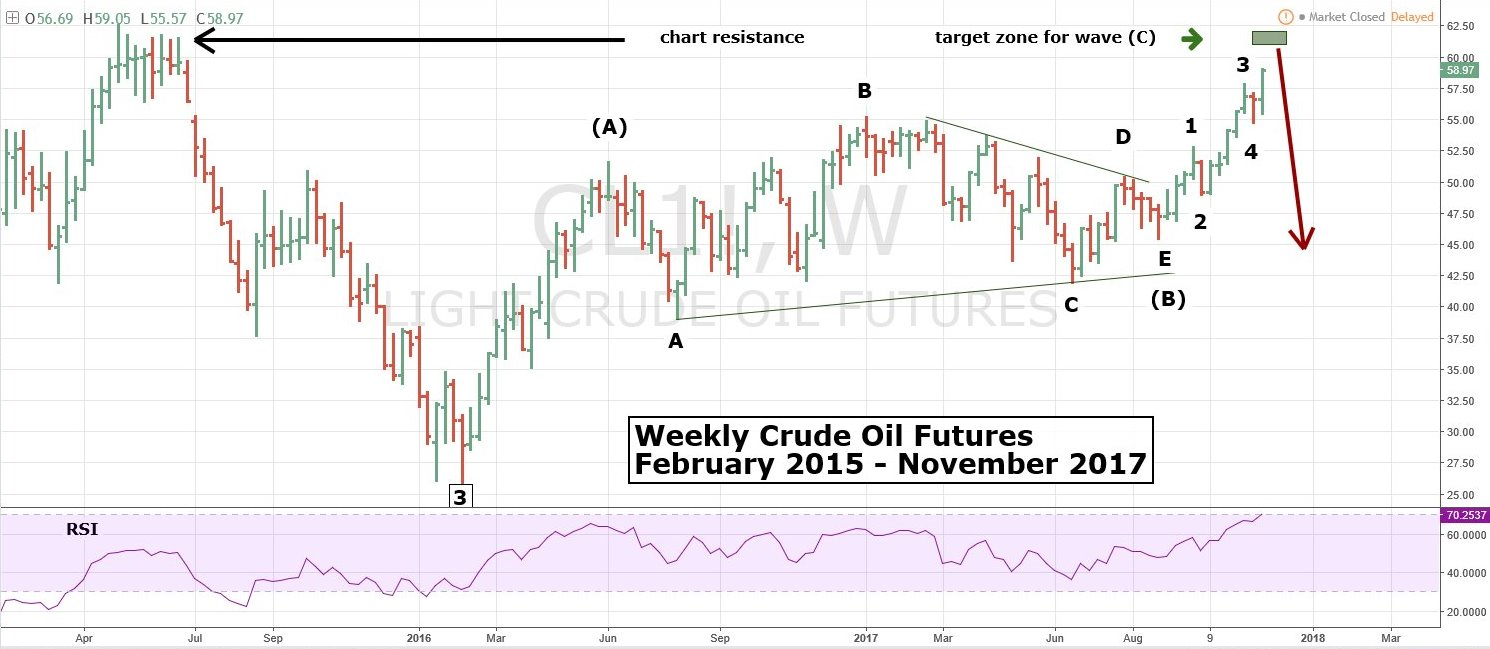
| Since early 2016 Crude Oil has been in a bull market. The rally has been choppy, and until recently the Elliott wave count was uncertain. Within the last several weeks a distinctive price pattern has emerged — indicating an important top could be imminent. The dimensions of Time, Sentiment, and Momentum provide supporting evidence of an approaching top. Fibonacci analysis reveals powerful resistance around 60.90 to 62.10. Price and Time Dimensions Please see the weekly Crude Oil chart illustrated in Figure 1. An Elliott wave rising "A-B-C" pattern from the bottom of 26.05 in the weekly Crude Oil futures appears to be complete or close to completion. What makes the overall pattern confusing is that Intermediate wave "(B)" appears to be an Elliott wave Horizontal Triangle. This type of structure only occurs in the positions of wave "B" and in wave "four" of motive waves. After completion of a Horizontal Triangle there's usually a strong post triangle thrust, which in this case is up. On the weekly chart this thrust has taken the shape of a very clear Elliott five-wave pattern. The close on November 24 was near the high point of the supposed fifth wave up. Normally within an "A-B-C" pattern there's a Fibonacci relationship between waves "A" and "C", either their equal or related by the Fibonacci ratio of .618. Intermediate degree wave "(A)" up from the major bottom of 26.05 is 25.62 points, multiplied by .618 equals 15.83 added to Intermediate wave "(B)" at 45.58 targets 61.41 as the completion point for Intermediate degree wave "(C)". Additionally, the post triangle thrust is usually equal to the widest part of a Horizontal Triangle. This is measured from the Minor wave "B" top at 55.24 to bottom of Minor wave "A" 39.09, which is 16.05 added to the low of wave "(B)" at 45.58 targets 61.63. Both close Fibonacci coordinates are around significant chart resistance created mid-year in 2015. Seasonally, December is a bearish month for Crude Oil. |
|
| Figure 1. An Elliott wave rising �A-B-C� pattern from the bottom of 26.05 in the weekly Crude Oil futures appears to be complete or close to completion. |
| Graphic provided by: Tradingview.com. |
| |
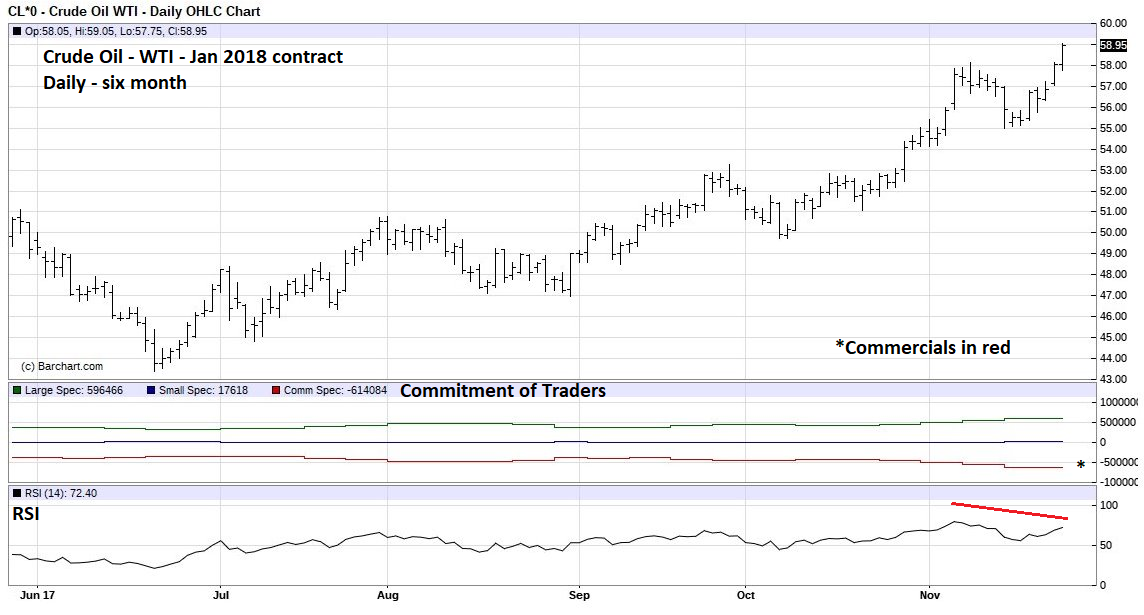
| Sentiment and Momentum Dimensions Please see daily Crude Oil chart illustrated in Figure 2. The Commitment of Traders report splits futures traders into three groups; Large Speculators, Small Speculators, and Commercials. The Commercials have the most futures contracts; this is the big money group you want to follow. Typically, large net long holdings by the Commercials will correspond to a significant bottom. Large net short holdings occur near significant tops. The net short position illustrated on the six-month chart is not only the largest for the prior six months, it is also the largest net short position the Commercials have taken in the last twenty years. The Momentum dimension illustrated by the daily RSI has a bearish divergence. The weekly RSI shown in Figure 1 has just entered the overbought zone above 70%. If the Elliott wave count is correct it implies a move down to the area of the last major bottom in the low $26 area. Crude Oil is seasonal bullish from January-May. Also, because of the overlap created by the supposed Horizontal Triangle there's considerable chart support in the 40.00-50.00 area. If some significant top forms and holds it could take a year for Crude Oil to reach the 26.00-30.00 zone. Near term, if December is bearish Crude Oil could reach 50.00-52.00 by late December. |
|
| Figure 2. The net short position illustrated on the six-month chart is not only the largest for the prior six months, it is also the largest net short position the Commercials have taken in the last twenty years. |
| Graphic provided by: Barcharts.com. |
| |
| Stock Market Update November 21 the S&P 500 (SPX) broke above the high made on November 7. This is significant because there were three-time cycles clustered on or near the 7th indicating a possible important top on that date. Time is now the most important dimension for US stocks. Since May there have been several strong momentum and sentiment signals which implied possible tops, none of these signals had any predictive value. The recent new SPX all-time high on November 24 again had strong bearish momentum and sentiment signals. Until proven otherwise we must assume these signals could also be ineffective. This leaves us focusing on the dimensions of Time and Price. There's round number resistance at SPX 2600 and two intermediate degree Fibonacci coordinates in the 2602-2603 area. The SPX broke through major Fibonacci resistance in the mid-2400 area. The next major Fibonacci target is at a much higher level. Probabilities favor the SPX moving beyond intermediate resistance and traveling upwards to major resistance. The Time dimension is usually bullish for US stocks until at least April. We can assume the SPX will continue to make more all-time highs in the coming months. However, there could be a subtle bearish signal given by the Time dimension on the last day of November. As of the day this article is being written — November 26 — the SPX is up from the end of October close price of 2575.26. November is usually the most bullish month for US stocks. If at the close of trading November 30, the SPX is even marginally below 2575.26 it could be the beginning of a more significant decline. More about this later if necessary. Short 25% stocks if the SPX breaks below 2544.00 and use the SPX all-time high as a stop loss. Further reading: Frost A.J and Robert Prechter (1985) "Elliott Wave Principle", New Classics Library. |
Independent investment advisor, trader and writer. He has written articles for Technical Analysis of Stocks & Commodities, Traders.com Advantage,Futuresmag.com and, Finance Magnates. Author of website Four Dimension Trading.
| Website: | www.fourdimensiontrading.com |
| E-mail address: | markrivest@gmail.com |
Click here for more information about our publications!
Comments

Request Information From Our Sponsors
- StockCharts.com, Inc.
- Candle Patterns
- Candlestick Charting Explained
- Intermarket Technical Analysis
- John Murphy on Chart Analysis
- John Murphy's Chart Pattern Recognition
- John Murphy's Market Message
- MurphyExplainsMarketAnalysis-Intermarket Analysis
- MurphyExplainsMarketAnalysis-Visual Analysis
- StockCharts.com
- Technical Analysis of the Financial Markets
- The Visual Investor
- VectorVest, Inc.
- Executive Premier Workshop
- One-Day Options Course
- OptionsPro
- Retirement Income Workshop
- Sure-Fire Trading Systems (VectorVest, Inc.)
- Trading as a Business Workshop
- VectorVest 7 EOD
- VectorVest 7 RealTime/IntraDay
- VectorVest AutoTester
- VectorVest Educational Services
- VectorVest OnLine
- VectorVest Options Analyzer
- VectorVest ProGraphics v6.0
- VectorVest ProTrader 7
- VectorVest RealTime Derby Tool
- VectorVest Simulator
- VectorVest Variator
- VectorVest Watchdog