HOT TOPICS LIST
- MACD
- Fibonacci
- RSI
- Gann
- ADXR
- Stochastics
- Volume
- Triangles
- Futures
- Cycles
- Volatility
- ZIGZAG
- MESA
- Retracement
- Aroon
INDICATORS LIST
LIST OF TOPICS
PRINT THIS ARTICLE
by Mark Rivest
Several factors hint at another bullish year for the major US stock indices.
Position: N/A
Mark Rivest
Independent investment advisor, trader and writer. He has written articles for Technical Analysis of Stocks & Commodities, Traders.com Advantage,Futuresmag.com and, Finance Magnates. Author of website Four Dimension Trading.
PRINT THIS ARTICLE
FIBONACCI
Forecast For US Stocks In 2020
01/09/20 03:40:59 PMby Mark Rivest
Several factors hint at another bullish year for the major US stock indices.
Position: N/A
| The US stock market has been rising year after year after year. Many analysts have been claiming the market is overbought, that sentiment is too bullish, that a major top could come soon. Commentary about the US stock market in late 2019? Perhaps, these types of comments were also made in 1997 and 1998, but the major peak didn't come until early 2000. The current US stock bull market that began in 2009 has characteristics similar to the thirteen-year bull market that lasted from 1987 to 2000. US stocks could continue climbing throughout 2020 and beyond. Long-Term Time Cycle Fibonacci ratios and sequences are used by traders/analysts to forecast price movements. The same analysis can also be applied to the time dimension determining when markets could turn. The Fibonacci sequence is: 1, 1, 2, 3, 5, 8, 13, 21, 34, 55, 89, 144, 233, ... to infinity. Classic examples of markets measured by the Fibonacci time sequence are: the Dow Jones Industrial Average (DJIA) almost exact five-year bull market from October 2002 to October 2007 and the fifty-five day DJIA decline/crash from August to October 1987. "Beautiful Pictures" by Robert Prechter illustrates hundreds of Fibonacci price and time relationships within the DJIA secular bull market July 1932 to January 2000. This extensive study is a must read for anyone interested in understanding how markets progress. Fibonacci analysis can be a great aid in determining where and when a market could turn. Please see the monthly DJIA chart illustrated in Figure 1. Four of the most significant DJIA turns in the Twentieth century — 1932, 1966, 1987, and 2000 — are all connected by the Fibonacci sequence: 1932 to 1966 - 34 years, 1966 to 1987 - 21 years, 1987 to 2000 - 13 years. Projecting the sequence from each time point targets the year 2021. This projects a market turn in 2021, not if the turn will be a top or bottom. It's possible that from now, late 2019/early 2020, a significant DJIA peak could be forming followed by a bear market terminating in 2021. However, momentum evidence hints that the current bull market could continue into 2021. |

|
| Figure 1. Four of the most significant DJIA turns in the Twentieth century (1932, 1966, 1987, and 2000) are all connected by the Fibonacci sequence. |
| Graphic provided by: tradingview.com. |
| |
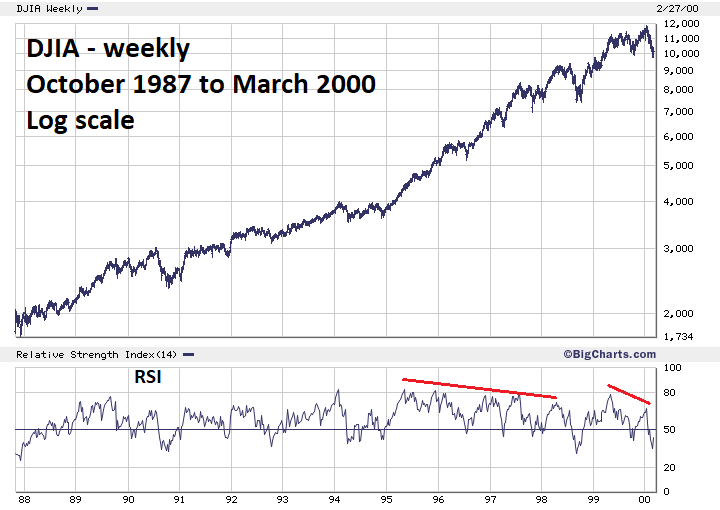
| Historical Comparison The closest bull market to the current cycle which began in March 2009 is the DJIA bull market that began in October 1987 and concluded in January 2000. This bull market probably drove the stock market bears crazy; from 1995 to 2000 market sentiment was extremely bullish -- a sign at major tops. What may have been even more maddening is that momentum kept showing signs of weakening. Please see the DJIA weekly chart 1987 to 2000 illustrated in Figure 2. Weekly RSI hit its maximum for the thirteen-year bull in the May 1995 and had a series of bearish divergences that lasted until January 2000. My January 15, 2018 article "RSI - The Super Indicator" noted that in January 2018 the DJIA weekly RSI hit its highest level in 48 years. Also noted, when RSI reaches its highest level of a bull cycle it almost always has to have at least one bearish divergence before a significant price peak is in place. The DJIA subsequently exceeded its January 2018 high with a bearish weekly RSI divergence and has continued into 2019 with higher prices. It was four and a half years from the May 1995 RSI weekly maximum until the DJIA bull concluded in January 2000. Adding four and a half years to the current weekly divergence in January 2018 targets June/July 2022 for the DJIA ultimate price peak. This would also make the current bull market thirteen years long, similar to the 1987 to 2000 bull market. Using the monthly RSI gets different results. DJIA monthly RSI maximum was in November 1996, three years and two months before the 2000 price top. Three years and two months after January 2018 targets March 2021 as a possible price top. |

|
| Figure 2. The closest bull market to the current cycle which began in March 2009 is the DJIA bull market that began in October 1987 and concluded in January 2000. |
| Graphic provided by: BigCharts.com. |
| |
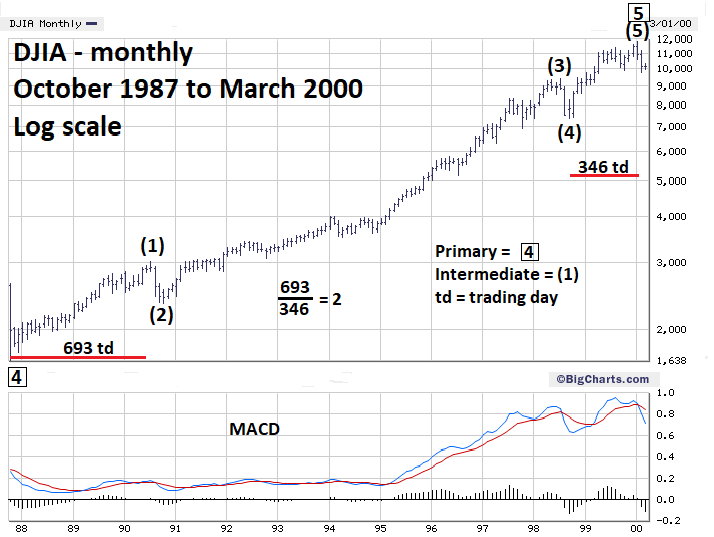
| Fibonacci Target - January 2000 The lowest Fibonacci sequence number to target 2021 is 21 years after the 2000 top. The next lower sequence number is 13, added to the 2007 peak targets 2020 as a possible turn. Adding 13 years to the 2009 bottom targets 2022. Both of these dates could mark a market turn but they don't tie in with the larger Fibonacci sequence that began in 1932. Are there any smaller scale times sequences that agree with a turn in 2021? Prechter's work examined the Fibonacci time relationships within the Super Cycle wave that began in 1932, then focused on the Fibonacci time relationships within the Cycle wave that began in 1974. Please see the monthly DJIA chart 1987 to 2000 illustrated in Figure 3. This chart focuses on the Fibonacci time relationships within the Primary wave that began in October 1987. The most common relationship between waves "one" and "five" of an impulse pattern is equality in price/time. The next most likely relationship is the Fibonacci ratio of 50%. Wave "one" could be 50% price/time to wave "five" or wave "five" could be 50% price/time to wave "one". Intermediate wave (1) of Primary wave 5 boxed that began on October 20, 1987 and ended on July 17, 1990 lasted 693 trading days. Intermediate wave (5) of Primary wave 5 boxed that began on September 1, 1998 and ended on January 14, 2000 was 346 trading days. The time relationship between the two waves is almost a perfect 50% 346/693 = 49.9% or 346 x 2.002 = 693. If you had knowledge of the DJIA wave structure from 1987 to 1999, a projection for almost the exact day of the bull market peak could have been made. |

|
| Figure 3. This chart focuses on the Fibonacci time relationships within the Primary wave that began in October 1987. |
| Graphic provided by: BigCharts.com. |
| |
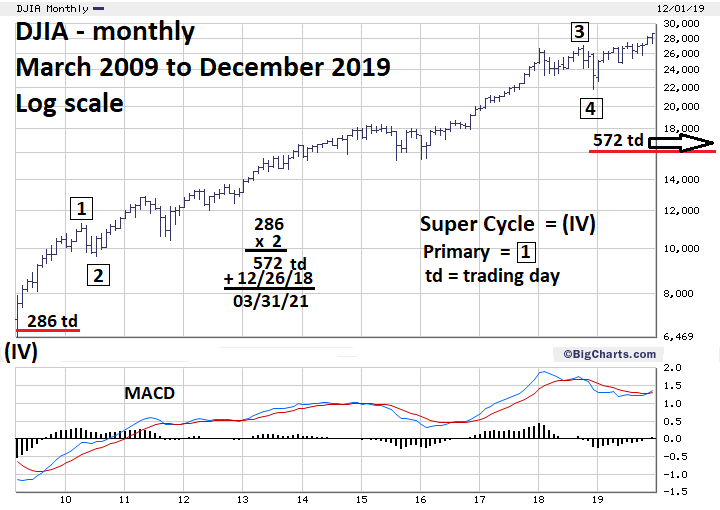
| Fibonacci Target - March 2021 Please see the monthly DJIA chart 2009 to 2019 illustrated in Figure 4. The bull market that began March 6, 2009 appears to be a developing Elliott five-wave impulse pattern. The supposed Primary wave 1 boxed lasted until April 26, 2010 — 286 trading days. The supposed Primary wave 4 boxed ended on December 26, 2018. If Primary wave 5 boxed equals Primary wave 1 then February 14, 2020 could be a turn date and probable peak if the DJIA rallies into that date. To get a tie in with the 2021 Fibonacci target, 286 trading days multiplied by 2 equals 572 trading days and targets March 31, 2021 as a probable top assuming the DJIA rallies into that date. March 2021 also has a monthly Fibonacci sequence relationship. If the current bull market that began in March of 2009 ends in March 2021 it will be a Fibonacci 144 months long. |

|
| Figure 4. If the current bull market that began in March of 2009 ends in March 2021 it will be a Fibonacci 144 months long. |
| Graphic provided by: BigCharts.com. |
| |
| Pieces of a Puzzle The last quarter of 2019 has seen hints that the bull market could continue well into 2020. My December 12, 2019 article "Stock Market Super Bullish Scenario" noted that an Elliott wave third of a third wave up could developing, opening the possibility of a strong rally until at least April 2020. My December 20, 2019 article "Stock Market Momentum Cycles" noted that based upon the then maximum number of new 52-week highs made in June 2019 that the bull market could continue into late 2020. Subsequently, the June 2019 52-week high maximum has been exceeded, opening the door for a rally into 2021. Elliott wave pattern, bullish momentum and Fibonacci time cycles are pieces of a puzzle that imply US stocks could continue to rally into the first quarter of 2021. Forecasts are not destiny; they give a framework of what could happen. If market action is contrary to the forecast, it could be an early warning to close out or reverse trades. Market movements in-line with the forecast can help to maximize profits. Further Reading: Prechter Jr. R. Robert (2003) "Beautiful Pictures", New Classics Library. Frost A.J and Robert Prechter (1985) "Elliott Wave Principle", New Classics Library. |
Independent investment advisor, trader and writer. He has written articles for Technical Analysis of Stocks & Commodities, Traders.com Advantage,Futuresmag.com and, Finance Magnates. Author of website Four Dimension Trading.
| Website: | www.fourdimensiontrading.com |
| E-mail address: | markrivest@gmail.com |
Click here for more information about our publications!
Comments

|

Request Information From Our Sponsors
- VectorVest, Inc.
- Executive Premier Workshop
- One-Day Options Course
- OptionsPro
- Retirement Income Workshop
- Sure-Fire Trading Systems (VectorVest, Inc.)
- Trading as a Business Workshop
- VectorVest 7 EOD
- VectorVest 7 RealTime/IntraDay
- VectorVest AutoTester
- VectorVest Educational Services
- VectorVest OnLine
- VectorVest Options Analyzer
- VectorVest ProGraphics v6.0
- VectorVest ProTrader 7
- VectorVest RealTime Derby Tool
- VectorVest Simulator
- VectorVest Variator
- VectorVest Watchdog
- StockCharts.com, Inc.
- Candle Patterns
- Candlestick Charting Explained
- Intermarket Technical Analysis
- John Murphy on Chart Analysis
- John Murphy's Chart Pattern Recognition
- John Murphy's Market Message
- MurphyExplainsMarketAnalysis-Intermarket Analysis
- MurphyExplainsMarketAnalysis-Visual Analysis
- StockCharts.com
- Technical Analysis of the Financial Markets
- The Visual Investor
