HOT TOPICS LIST
- MACD
- Fibonacci
- RSI
- Gann
- ADXR
- Stochastics
- Volume
- Triangles
- Futures
- Cycles
- Volatility
- ZIGZAG
- MESA
- Retracement
- Aroon
INDICATORS LIST
LIST OF TOPICS
PRINT THIS ARTICLE
by Mark Rivest
How strong is the current US stock market rally?
Position: N/A
Mark Rivest
Independent investment advisor, trader and writer. He has written articles for Technical Analysis of Stocks & Commodities, Traders.com Advantage,Futuresmag.com and, Finance Magnates. Author of website Four Dimension Trading.
PRINT THIS ARTICLE
MOMENTUM
Stock Market Momentum Cycles
12/20/19 04:33:44 PMby Mark Rivest
How strong is the current US stock market rally?
Position: N/A
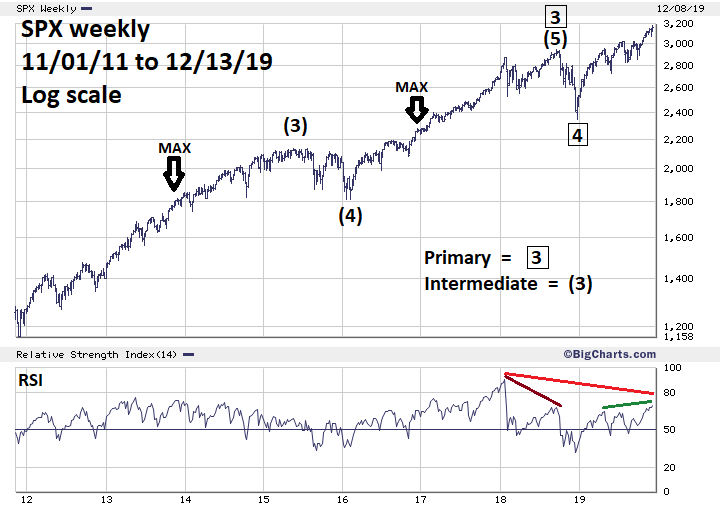
| In the early twentieth century Charles Dow discovered that stock bull markets had three phases. The first phase is a rebound from the depressed conditions of the prior bear market. The second phase is the longest and strongest and represents improving economic fundamentals. In the third phase, the economy/stocks are still improving but at a slower rate than the second phase, while optimism is at its high point. These phases are a main tenet of what is now call "Dow Theory" and became the foundation for R.N. Elliott's discovery of the wave principle. Momentum indicators help identify market cycles. S&P 500 - Weekly Please see the weekly S&P 500 (SPX) chart illustrated in Figure 1. For clarity and comparability with the NYSE 52-week new highs and Bullish Percentage Index charts, the SPX chart begins in November 2011, not the beginning of the bull market in March 2009. The most striking aspect on this chart is that the RSI, which is one of the most reliable momentum oscillators, reached its highest level of the entire bull market in January 2018. My January 15, 2018 article "RSI - The Super Indicator" noted RSI almost always has at least one bearish divergence at stock market peaks. The January 2018 weekly RSI reading of 90% forecasted higher SPX prices later in 2018 with at least one RSI bearish divergence. This did happen in September 2018 which was the prelude to a three-month correction. In October 2019 RSI broke above a divergence that was made in September 2019 — a bullish signal. Subsequently, the RSI continued to rise and, in the week ending December 13, it reached 69%, exceeding the 68% reading made in September 2018, another bullish signal. While these break outs are near-term bullish, there's a long-term bearish divergence with the 90% reading made in January 2018. There's no way to forecast when a downturn could begin only using the weekly RSI. Consider the divergence as a warning of an approaching decline. |

|
| Figure 1. The January 2018 weekly RSI reading of 90% forecasted higher SPX prices later in 2018 with at least one RSI bearish divergence. |
| Graphic provided by: BigCharts.com. |
| |
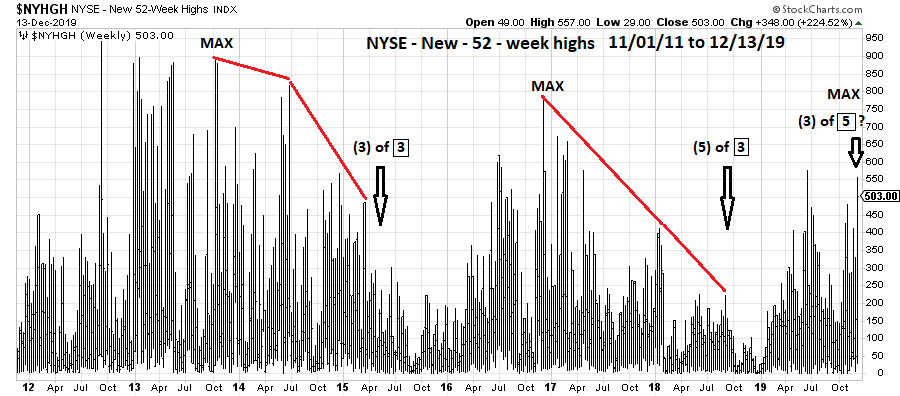
| NYSE 52-week New Highs Perhaps the best tool to discover the phase of a stock bull market is the number of stocks making new 52-week highs. Please see the weekly NYSE new 52-week highs chart illustrated in Figure 2. The maximum number of new highs came in a series of peaks from late 2012 to late 2013. The last of these came in October 2013, about the exact center of what counts as an Elliott five wave impulse up from the March 2009 bear market bottom. Also note that within this supposed third of a third wave up it took about a year and a half of several bearish divergences before a downturn occurred. In the next phase, what counts as Intermediate wave (5) of Primary wave "3" boxed, the lead time was only about one year. Perhaps if the SPX is currently in Primary wave "5" boxed the lead time from the current maximum strength will be less than one year. |

|
| Figure 2. The maximum number of new highs came in a series of peaks from late 2012 to late 2013. |
| Graphic provided by: StockCharts.com. |
| |
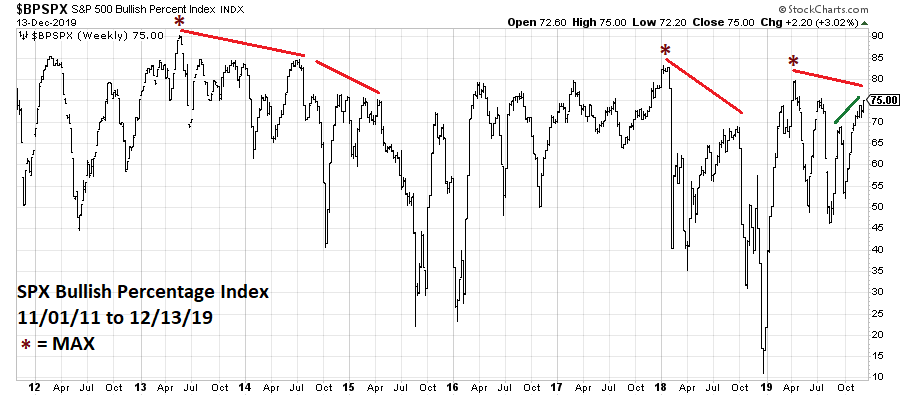
| S&P 500 - Bullish Percent Index My October 24, 2019 article "The Bullish Percent Index" noted bearish divergences warning of a sharp stock market decline. Please see the SPX Bullish Percentage Index ($BPSPX) illustrated in Figure 3. In late October the bearish divergence was broken — a bullish signal. So far, this index is still below the high point for the current cycle made in May 2019. If the index remains below this benchmark it could still take at least several weeks before a significant SPX peak could be in place. Again, note the lead time between max points and downturns. Also note that $BPSPX, like the NYSE 52-week highs, has declining max points for each phase. This is the signature of a late stage secular bull market. |

|
| Figure 3. In late October the bearish divergence was broken — a bullish signal. |
| Graphic provided by: StockCharts.com. |
| |
| Summary Currently, based on the NYSE 52-week highs there's a secular degree double bearish divergence off the 2013 and 2017 max points. Near term, the NYSE 52-week highs are testing the 2019 max point. The divergences off the 2017 max point took about one year, less time than the divergences off the 2013 max point. If this trend of diminishing time between max point and market downturn continues, then perhaps a downturn could occur six to ten months after the max point of late June 2019. This gives a time window of late December 2019 to late April 2020 for the start of a decline. This assumes the late June 2019 max point holds. This max point of new 52-week highs is perhaps the most important indicator for US stocks. If the late June peak level is exceeded it opens the door for a rally to SPX 4000 discussed in my December 12, 2019 article "Stock Market Super Bullish Scenario". If the max point holds then the SPX target of 3300 noted in my December 5, 2019 article "Setting Trading Targets - Part Two" could be in play. Further Reading: Russell Richard (1958-59-60 - Copyright Barron's) "The Dow Theory Today" Fraser Publishing Company Edition 1981. Frost A.J and Robert Prechter (1985) "Elliott Wave Principle", New Classics Library. |
Independent investment advisor, trader and writer. He has written articles for Technical Analysis of Stocks & Commodities, Traders.com Advantage,Futuresmag.com and, Finance Magnates. Author of website Four Dimension Trading.
| Website: | www.fourdimensiontrading.com |
| E-mail address: | markrivest@gmail.com |
Click here for more information about our publications!
PRINT THIS ARTICLE

|

Request Information From Our Sponsors
- StockCharts.com, Inc.
- Candle Patterns
- Candlestick Charting Explained
- Intermarket Technical Analysis
- John Murphy on Chart Analysis
- John Murphy's Chart Pattern Recognition
- John Murphy's Market Message
- MurphyExplainsMarketAnalysis-Intermarket Analysis
- MurphyExplainsMarketAnalysis-Visual Analysis
- StockCharts.com
- Technical Analysis of the Financial Markets
- The Visual Investor
- VectorVest, Inc.
- Executive Premier Workshop
- One-Day Options Course
- OptionsPro
- Retirement Income Workshop
- Sure-Fire Trading Systems (VectorVest, Inc.)
- Trading as a Business Workshop
- VectorVest 7 EOD
- VectorVest 7 RealTime/IntraDay
- VectorVest AutoTester
- VectorVest Educational Services
- VectorVest OnLine
- VectorVest Options Analyzer
- VectorVest ProGraphics v6.0
- VectorVest ProTrader 7
- VectorVest RealTime Derby Tool
- VectorVest Simulator
- VectorVest Variator
- VectorVest Watchdog
