

HOT TOPICS LIST
- MACD
- Fibonacci
- RSI
- Gann
- ADXR
- Stochastics
- Volume
- Triangles
- Futures
- Cycles
- Volatility
- ZIGZAG
- MESA
- Retracement
- Aroon
INDICATORS LIST
LIST OF TOPICS
PRINT THIS ARTICLE
by Mark Rivest
With all three main US stock indices at all-time highs where's major resistance?
Position: N/A
Mark Rivest
Independent investment advisor, trader and writer. He has written articles for Technical Analysis of Stocks & Commodities, Traders.com Advantage,Futuresmag.com and, Finance Magnates. Author of website Four Dimension Trading.
PRINT THIS ARTICLE
ELLIOTT WAVE
Setting Trading Targets - Part Two
12/05/19 05:04:15 PMby Mark Rivest
With all three main US stock indices at all-time highs where's major resistance?
Position: N/A
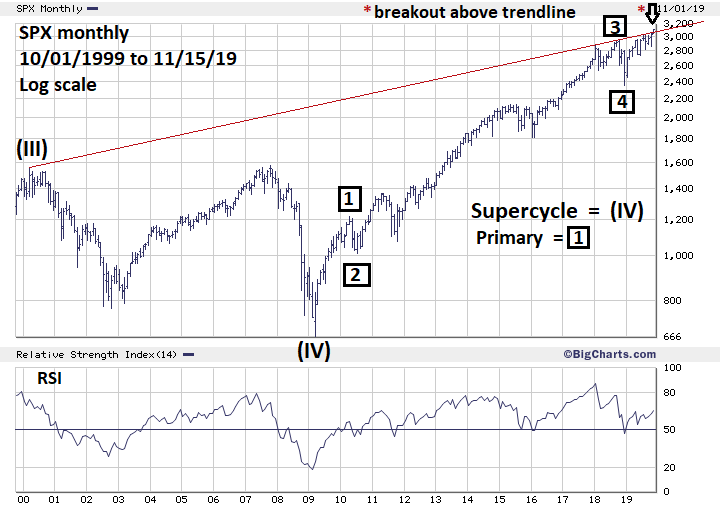
| All markets are attracted to Fibonacci turn points either from a retracement or extension. They're perhaps the best tools to discovering market bottoms and tops. On October 30, 2019, the S&P 500 (SPX) exceeded a major Fibonacci coordinate at 3047.30. This level is derived from the length of the SPX 2007 to 2009 bear market of 909.30 points multiplied by the Fibonacci ratio of 2.618, which yields 2380.50, added to the March 2009 bottom of 666.80 targets 3047.30. With all Fibonacci coordinates allow for leeway, bulls-eye hits are rare. The 3047 target comes from points of origin going back more than a decade and a considerable percentage gain. A leeway of fifty points is logical and SPX 3100 is potential round number resistance. The leeway resistance has been breached, leading to the question — where is the next major resistance area? S&P 500 - Monthly The SPX 3047 target was originally noted in my February 1, 2018 article "How High Is Up?" My August 15, 2019 article "The Final Pieces Of A Ten-Year Puzzle?" noted the SPX had reached the area of a nineteen-year rising trend line. Please see the monthly SPX chart illustrated in Figure 1. This is an update of the monthly SPX chart illustrated in the August 15 article, note the SPX has at least marginally exceeded the trendline. While it can be argued this break is not decisive, it's harder to argue that major Fibonacci resistance has not been exceeded. Markets are drawn to Fibonacci coordinates like moths to flame. The clues to finding the next potential resistance zone may be found by examining Fibonacci relationships within the SPX bull market from the bottom made in 2009. My June 28 article "Setting Trading Targets" noted usually within a five wave Elliott Impulsive pattern there's a relationship between waves "one" and "five" of either equality or 50%. The supposed Primary wave "1" boxed from SPX 666 to 1218 gained 82.9%, multiplied by 50% equals 41.4%. Applying a growth rate of 41.4% to the supposed Primary wave "4" bottom made in December 2018 at 2346.60 yields a target of 3318.10. A second confirming Fibonacci calculation can be found by taking the September to December 2018 decline of 594.30 points multiplied by the Fibonacci extension ratio of 1.618 equals 961.60 points added to the low of 2346.60 targets 3308.20. Using this same technique with the May to June 2019 decline of 225.30 points multiplied by 2.618 equals 589.80 points, added to the June 3, 2019 bottom of 2728.80 yields 3318.60. Three Fibonacci coordinates in a tight cluster strongly implies the low 3300 area could be significant resistance. |
|
| Figure 1. The SPX has at least marginally exceeded the trendline. |
| Graphic provided by: BigCharts.com. |
| |
| S&P 500 - Daily. Prime Wave Count There's always more than one Elliott wave count, sometimes several. Use evidence from the dimensions of Time, Momentum and Sentiment to aid in discovering the best wave count. Within the Time dimension seasonal patterns for US stocks are bullish until at least the first quarter of 2020. Also, as noted in my November 14 article "Messages From The Transportation Stocks - Part Two", the Bullish Percentage index has erased the bearish divergence. This implies bullish momentum for at least the next several weeks. Please see the daily SPX chart illustrated in Figure 2. The so far choppy rally since the December 2018 bottom appears to be a developing Elliott wave Ending Diagonal Triangle (EDT). This is a termination pattern of the primary trend and appears only in the fifth wave position of motive waves and in wave "C" of corrective waves. EDT's are unique in that they are the only motive wave in which all five sub waves are composed of three waves. If this count is correct the supposed Intermediate wave (3) could be nearing completion as the SPX approaches the daily trendline connecting the May and June peaks. A move below the August 5 bottom at 2822 would eliminate this count and open the door for a move down to at least the next support level at 2728. |

|
| Figure 2. Intermediate wave (3) could be nearing completion as the SPX approaches the daily trendline connecting the May and June peaks. |
| Graphic provided by: tradingview.com. |
| |
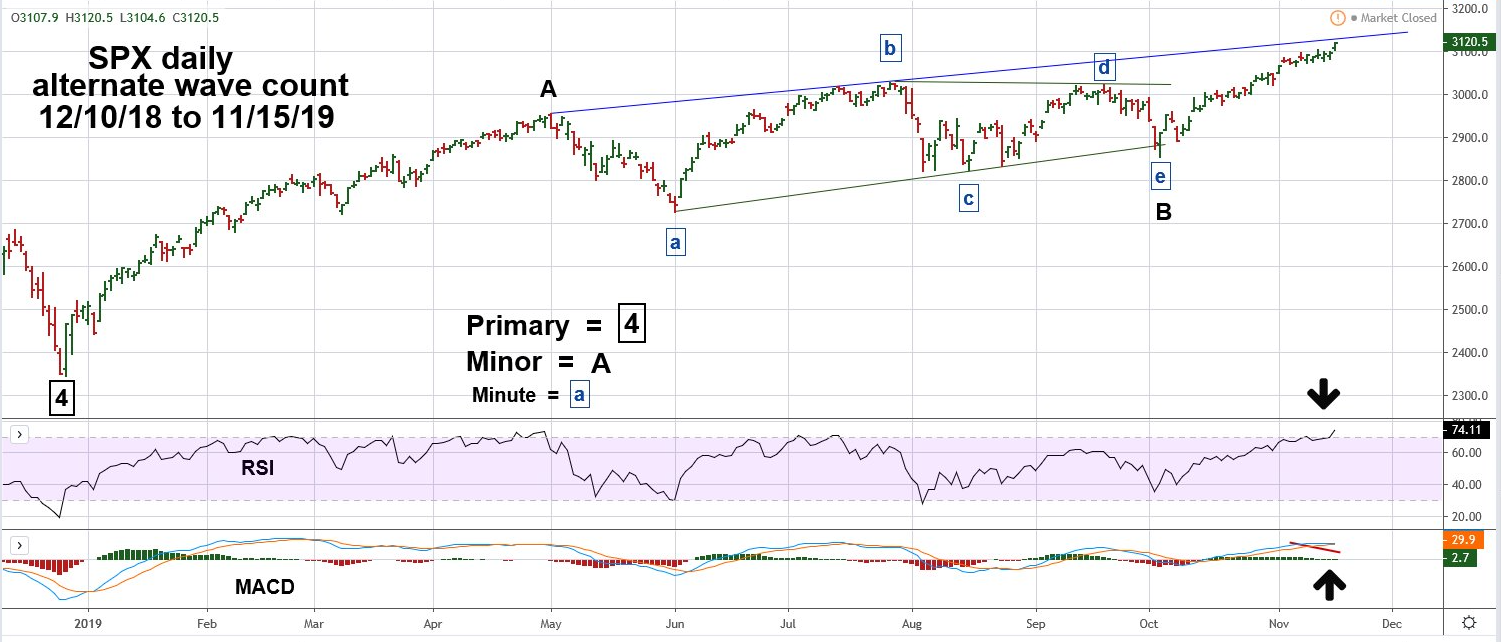
| S&P 500 - Daily. Alternate Wave Count Please see the daily SPX chart illustrated in Figure 3. In this alternate count, Intermediate wave (1) of the EDT is still under construction. An Elliott wave Horizontal Triangle composes the supposed Minor wave "B". After completion of wave (1), the supposed wave (2) could bottom in the 2500 area. Note the daily RSI on November 15 hit its highest level since the rally began in late December 2018. For stocks, the RSI almost always has at least one bearish divergence before a significant decline. The maximum reading made on the 15th implies higher SPX prices in the next several weeks. Bearish divergence on the MACD-histogram hints at least a short-term decline could begin soon. |
|
| Figure 3. Note the daily RSI on November 15 hit its highest level since the rally began in late December 2018. |
| Graphic provided by: tradingview.com. |
| |
| Be Prepared Because of the Ending Diagonal Triangle's unique characteristics, they give very accurate signals of a coming trend change. The important downside price level is 2822, if it's violated the alternate count would become the prime count. If the SPX continues its steady rally it could eliminate the EDT count and open the door for a more bullish wave count. This possibility will be discussed in a future article if necessary. There's no pre-destiny in any market. The mass mind can and will change just as an individual mind can change. Traders that are prepared for change have a greater chance to reduce losses and increase gains. Further Reading: Frost A.J and Robert Prechter (1985) "Elliott Wave Principle", New Classics Library. |
Independent investment advisor, trader and writer. He has written articles for Technical Analysis of Stocks & Commodities, Traders.com Advantage,Futuresmag.com and, Finance Magnates. Author of website Four Dimension Trading.
| Website: | www.fourdimensiontrading.com |
| E-mail address: | markrivest@gmail.com |
Click here for more information about our publications!
PRINT THIS ARTICLE

Request Information From Our Sponsors
- StockCharts.com, Inc.
- Candle Patterns
- Candlestick Charting Explained
- Intermarket Technical Analysis
- John Murphy on Chart Analysis
- John Murphy's Chart Pattern Recognition
- John Murphy's Market Message
- MurphyExplainsMarketAnalysis-Intermarket Analysis
- MurphyExplainsMarketAnalysis-Visual Analysis
- StockCharts.com
- Technical Analysis of the Financial Markets
- The Visual Investor
- VectorVest, Inc.
- Executive Premier Workshop
- One-Day Options Course
- OptionsPro
- Retirement Income Workshop
- Sure-Fire Trading Systems (VectorVest, Inc.)
- Trading as a Business Workshop
- VectorVest 7 EOD
- VectorVest 7 RealTime/IntraDay
- VectorVest AutoTester
- VectorVest Educational Services
- VectorVest OnLine
- VectorVest Options Analyzer
- VectorVest ProGraphics v6.0
- VectorVest ProTrader 7
- VectorVest RealTime Derby Tool
- VectorVest Simulator
- VectorVest Variator
- VectorVest Watchdog