

HOT TOPICS LIST
- MACD
- Fibonacci
- RSI
- Gann
- ADXR
- Stochastics
- Volume
- Triangles
- Futures
- Cycles
- Volatility
- ZIGZAG
- MESA
- Retracement
- Aroon
INDICATORS LIST
LIST OF TOPICS
PRINT THIS ARTICLE
by Mark Rivest
Dow Jones Transportation Average could signal bull market termination.
Position: N/A
Mark Rivest
Independent investment advisor, trader and writer. He has written articles for Technical Analysis of Stocks & Commodities, Traders.com Advantage,Futuresmag.com and, Finance Magnates. Author of website Four Dimension Trading.
PRINT THIS ARTICLE
ELLIOTT WAVE
Messages From the Transportation Stocks - Part Two
11/14/19 04:07:39 PMby Mark Rivest
Dow Jones Transportation Average could signal bull market termination.
Position: N/A
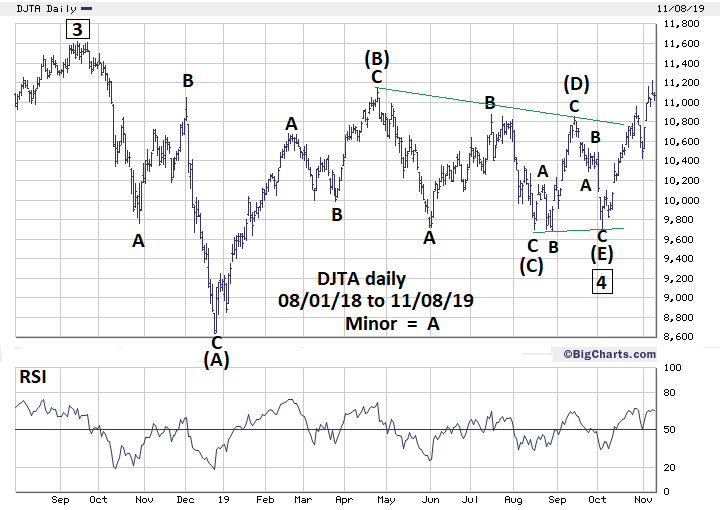
| Daily and weekly Elliott wave patterns for the Dow Jones Transportation Average (DJTA) strongly suggest this index is in the final thrust up of its bull market that began in 2009. In early November, seasonal and momentum factors for US stock turned bullish and the rally could continue into at least the first quarter of 2020. If the DJTA completes an Elliott wave pattern in early 2020 it could be the harbinger of a global bear market. Dow Jones Transportation Average - Daily My July 25 article "Messages From the Transportation Stocks" noted that the DJTA may have completed an Elliott wave Horizontal Triangle. This structure only appears within the fourth wave position of motive waves and in wave "B" of corrective patterns. Each of the five sub-waves of a Horizontal Triangle subdivide into either three wave patterns or a combination of three wave patterns. It appeared that the DJTA had completed a Horizontal Triangle on July 11, 2019 at 10260 — this was incorrect. Instead of continuing the supposed post triangle thrust up, the DJTA meandered sideways. Please see the daily DJTA chart illustrated in Figure 1. The Horizontal Triangle counts as complete at the October 3 bottom at 9708. Two factors suggest this time the true triangle termination point is in place: US stocks are seasonally bullish from November until May, and the DJTA has exceeded the supposed Intermediate degree wave ( B ) peak at 11148. Within Horizontal Triangles the most common Fibonacci relationships occur among the alternate waves. In this case wave ( C ) is .492 of wave ( A ), almost an exact .50 Fibonacci ratio. Wave ( D ) is .469 of wave ( B ), also close to .50. Wave ( E ) is .384 of wave ( A ), a near bulls-eye to the Fibonacci ratio of .382. After completion of a Horizontal Triangle there's usually a powerful thrust in the direction of the primary trend, which in this case is up. If the DJTA Horizontal Triangle is complete it implies a rapid move up to at least marginally above the all-time high at 11623. |
|
| Figure 1. After completion of a Horizontal Triangle there�s usually a powerful thrust in the direction of the primary trend, which in this case is up. |
| Graphic provided by: BigCharts.com. |
| |
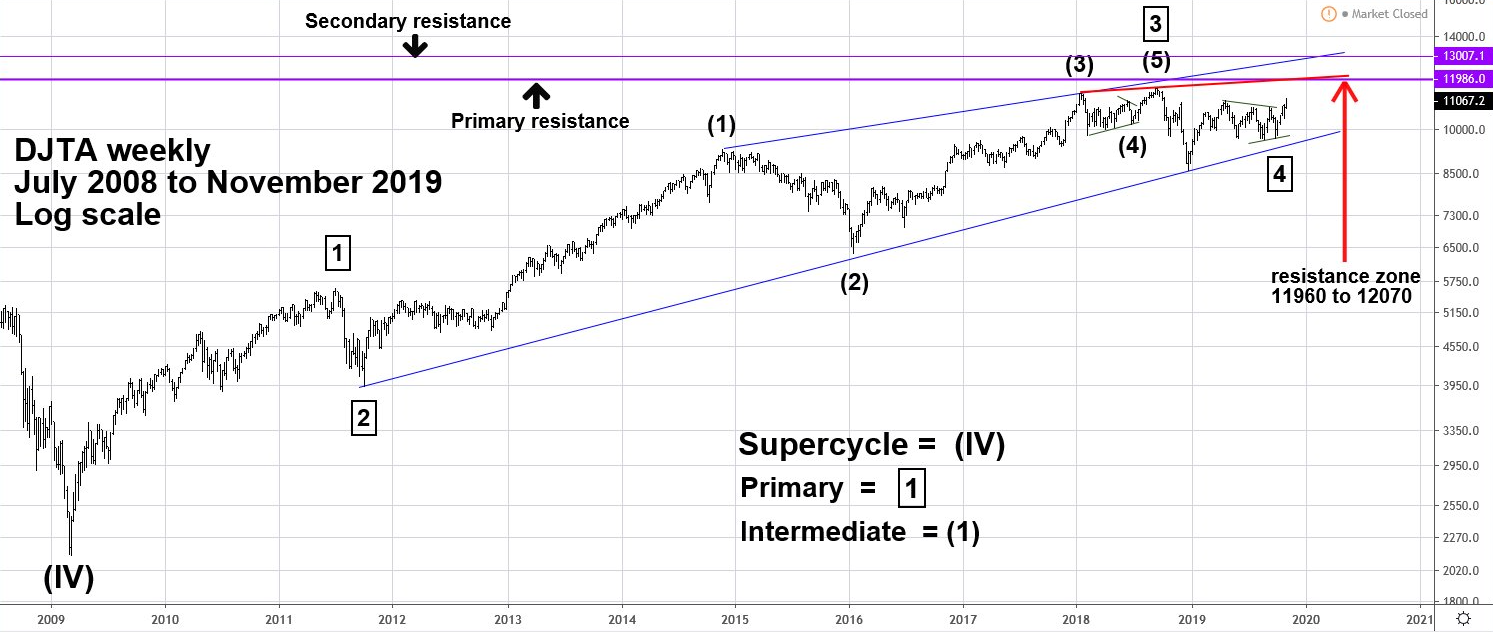
| Dow Jones Transportation Average - Weekly Please see the weekly DJTA chart illustrated in Figure 2. When measuring Elliott waves in markets or stocks that have had large percentage gains, it's best to use logarithmic scale because the movement from 10.00 to 15.00 is not comparable to a move from 100.00 to 105.00. The growth rate of the supposed Primary wave "1" from its major bottom in 2009 at 2134.20 was 163.7%. Primary wave "3" growth was 192.4%. Usually there's a Fibonacci relationship between waves "one" and "five". The most dynamic movement for the DJTA and the main US stock indices occurred prior to 2015. The slowing momentum since then is what is expected in a late stage bull market. Therefore, it's logical to expect the DJTA Primary wave "five" to have a smaller growth rate than wave "one", perhaps much smaller. Trendlines can be used to determine targets for potential resistance. The trendline connecting the November 2014 high with the January 2018 top crosses the low 13000 area in the first quarter of 2020. The 163.7% growth of Primary wave "1" multiplied by .382 gives a growth rate for wave Primary wave "5" of 62.50% — which from the low point of Primary wave "4" at 8636 targets 14033. This is nowhere near the trendline. Without a confirming calculation it's doubtful the trendline from 2014 could be potential resistance. Typically, the move after completion of a Horizontal Triangle can be measured by its widest part. From the DJTA all-time high at 11623 to the supposed wave ( A ) bottom of 8636 is 2987 points. Adding this to the Horizontal Triangle termination point at 9708 targets DJTA 12695. This point, while not at any trendline, at least is logical from an Elliott wave perspective and is an acceptable secondary upside target. Using the trendline connecting the peak made in January 2018 with the top made in September 2018 projects into the low 12000 in the first quarter 2020. This area makes more sense with slowing late stage bull market momentum. Multiplying the 163.7% growth of Primary wave "1" by the Fibonacci ratio of .236 equals a 38.6% growth rate. This rate off the bottom at 8636 targets DJTA 11973, close to the trendline from January 2018. The DJTA could top somewhere in the leeway zone of 11960 to 12070 during the first quarter 2020. |
|
| Figure 2. The DJTA could top somewhere in the leeway zone of 11960 to 12070 during the first quarter 2020. |
| Graphic provided by: tradingview.com. |
| |
| Comprehensive View My September 19 article "Bearish Months For The Stock Market" noted that the US stock market was notorious for declining in the months of September and October. My October 24 article "The Bullish Percent Index" focused on this indicator and its potential bearish divergence. Also noting that if the Bullish Percent Index continued to rise after the October 18 bottom it could significantly reduce the chances of a sharp decline. The index did continue to rise, right on the cusp of the bullish season for stocks. The bearish divergence for the Bullish Percent Index has been eliminated — another bullish factor. The US, European, and now Asian stock markets are in rally mode, and likely to continue for several weeks. Focus on the DJTA. Its very clear Elliott wave pattern combined with potential trendline resistance makes it a much watch index. If the DJTA reaches the low 12000 area in the next several weeks and then turns down, it could be a warning sign the ten-year bull market is ending. Further Reading: Frost A.J and Robert Prechter (1985) "Elliott Wave Principle", New Classics Library. |
Independent investment advisor, trader and writer. He has written articles for Technical Analysis of Stocks & Commodities, Traders.com Advantage,Futuresmag.com and, Finance Magnates. Author of website Four Dimension Trading.
| Website: | www.fourdimensiontrading.com |
| E-mail address: | markrivest@gmail.com |
Click here for more information about our publications!
PRINT THIS ARTICLE

Request Information From Our Sponsors
- StockCharts.com, Inc.
- Candle Patterns
- Candlestick Charting Explained
- Intermarket Technical Analysis
- John Murphy on Chart Analysis
- John Murphy's Chart Pattern Recognition
- John Murphy's Market Message
- MurphyExplainsMarketAnalysis-Intermarket Analysis
- MurphyExplainsMarketAnalysis-Visual Analysis
- StockCharts.com
- Technical Analysis of the Financial Markets
- The Visual Investor
- VectorVest, Inc.
- Executive Premier Workshop
- One-Day Options Course
- OptionsPro
- Retirement Income Workshop
- Sure-Fire Trading Systems (VectorVest, Inc.)
- Trading as a Business Workshop
- VectorVest 7 EOD
- VectorVest 7 RealTime/IntraDay
- VectorVest AutoTester
- VectorVest Educational Services
- VectorVest OnLine
- VectorVest Options Analyzer
- VectorVest ProGraphics v6.0
- VectorVest ProTrader 7
- VectorVest RealTime Derby Tool
- VectorVest Simulator
- VectorVest Variator
- VectorVest Watchdog