

HOT TOPICS LIST
- MACD
- Fibonacci
- RSI
- Gann
- ADXR
- Stochastics
- Volume
- Triangles
- Futures
- Cycles
- Volatility
- ZIGZAG
- MESA
- Retracement
- Aroon
INDICATORS LIST
LIST OF TOPICS
PRINT THIS ARTICLE
by Mark Rivest
A fresh perspective on a classic Dow Theory signal.
Position: N/A
Mark Rivest
Independent investment advisor, trader and writer. He has written articles for Technical Analysis of Stocks & Commodities, Traders.com Advantage,Futuresmag.com and, Finance Magnates. Author of website Four Dimension Trading.
PRINT THIS ARTICLE
DOW THEORY
Messages From The Transportation Stocks
07/25/19 04:51:09 PMby Mark Rivest
A fresh perspective on a classic Dow Theory signal.
Position: N/A
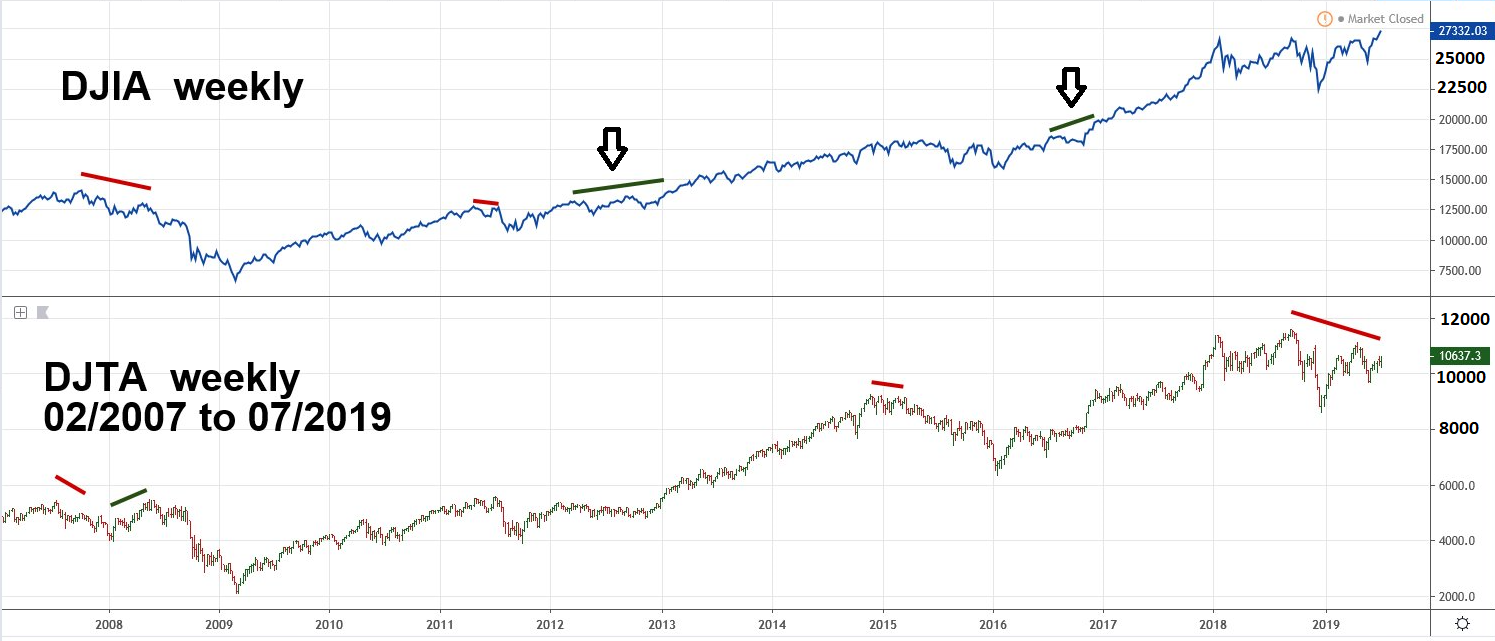
| The Dow Theory for analyzing the stock market was developed in the late nineteenth century by Charles H. Dow. A main part of the theory is that divergences between the Industrial Stock Index and what was then called the Rail Stock Index (now called the Transport stocks) could forecast a change in the direction of the stock market. Massive changes in the economy have made this divergence signal less reliable, however the Dow Jones Transportation Average (DJTA) in July 2019 could be delivering a powerful message. Industrial/Transportation Averages Since 2007 Dow Theory states that if both the IndustrialIindex and the Rail Index confirmed each new high/low it indicated the stock market primary trend could continue. If, however, the primary trend was up, and the Industrial Index failed to confirm a new high for the Rail Index, this could signal an approaching bear market. The divergent signal was very effective while the Rails/Transport companies were a significant part of the overall economy. With greater economic diversification the situation has changed. In the final third of the twentieth century great technological advancements grew and diversified the economy. New sectors such as Biotechnology and the Internet diminished the weighting of transportation companies within the general economy. The effects of which can be seen in the weekly Dow Jones Industrial Average (DJIA) and DJTA chart illustrated in Figure 1. July 2007 saw new bull market highs for both the DJIA and DJTA, in October only the DJIA made a new high — a Dow Theory non confirmation signal. Subsequently both indices declined until January 2008, after which the DJTA outperformed on the upside and made a new all-time high in May 2008 unconfirmed by the industrials. Did this new DJTA high invalidate the prior bearish signal? Should you continue to hold stocks or even initiate new long positions? If you did, you bought into one of the biggest stock market declines in decades. Both indices made major bottoms in March of 2009 and there was no subsequent divergent signal to go long. The next signal came in July 2011 with the transports making a new post-2009 rally high unconfirmed by the Industrials. This developed into a multi-month decline. Later in 2012 and 2016 the DJIA made new unconfirmed highs which did not trigger a significant market decline. In both instances the industrials continued to outperform the transports before the DJTA finally was able to confirm the bull market. Selling on the divergent signals in 2012 and 2016 would have been a mistake. The most recent signal occurred just after the September 2018 DJIA/DJTA bull market tops. The DJTA as of July 12 has a double bearish divergence since it failed to confirm even the top the DJIA made in April 2019. Could this be a super bearish signal? Perhaps, a view from an Elliott wave perspective gives a different message. |
|
| Figure 1. July 2007 saw new bull market highs for both the DJIA and DJTA. In October only the DJIA made a new high � a Dow Theory non confirmation signal. |
| Graphic provided by: tradingview.com. |
| |
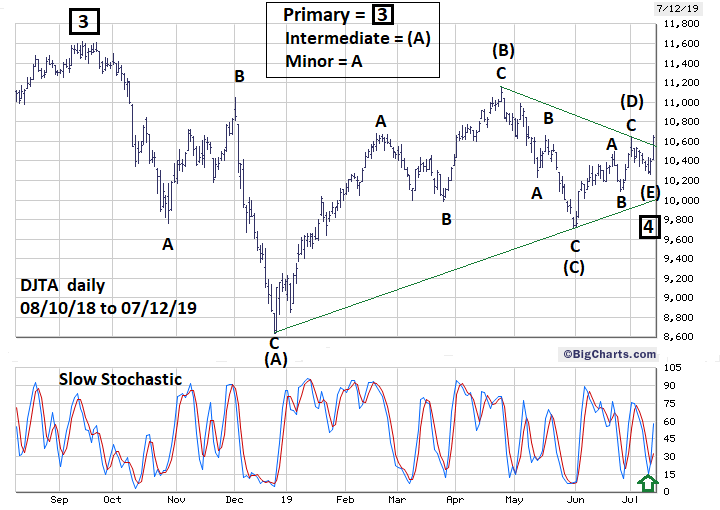
| Dow Jones Transportation Average Since 2018 Please see the daily DJTA chart illustrated in Figure 2. The DJTA pattern from its all-time high in September of 2018 appears to be an Elliott wave Horizontal Triangle. This structure only appears within the fourth wave position of motive waves and in wave "B" of corrective patterns. Each of the five sub waves of a Horizontal Triangle subdivide into either three wave patterns or a combination of three wave patterns. Waves (A) and (B) of the DJTA supposed Horizontal Triangle are clearly three-wave structures. The most common Fibonacci relationships occur among the alternate waves. In this case the supposed wave (C) is .48 of the supposed wave (A), close to the Fibonacci relationship of .50. The supposed wave (D) is .37 of the supposed wave (B), close to the Fibonacci relationship of .382. After completion of Horizontal Triangles there's usually a powerful trust in the direction of the primary trend, which in this case is up. Most of the time the length of the trust can be measured by the widest part of the triangle. For the DJTA Horizontal Triangle its intermediate degree wave (A) of 2986.80 points, added to the termination point of the triangle at the supposed wave (E) bottom of 10260.30 targets DJTA 13247.10 as a bull market termination point. For confirmation of completion of a post triangle thrust the rally would only need to exceed the September 2018 high of 11623.60. Perhaps the thrust off of 10260.30 could be .618 of the supposed wave (A). 2986.80 x .618 = 1845.80 + 10260.30 targets DJTA 12106.10 as an alternate bull market peak. |
|
| Figure 2. The DJTA pattern from its all-time high in September of 2018 appears to be an Elliott wave Horizontal Triangle. |
| Graphic provided by: BigCharts.com. |
| |
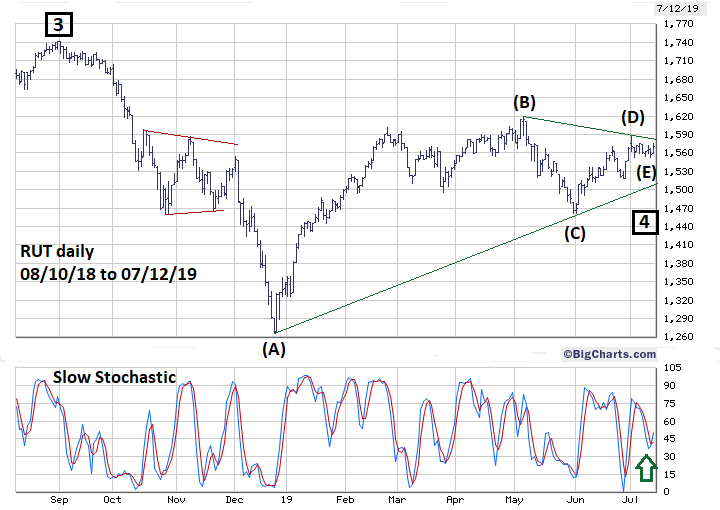
| Russell 2000 Index Since 2018 The small cap Russell 2000 (RUT) also appears to have formed a Horizontal Triangle from its September 2018 top. Please see the RUT daily chart illustrated in Figure 3. Note that the mid part of the supposed Intermediate degree wave (A) looks like a completed smaller degree Horizontal Triangle — which in this case Minor wave "B". The subsequent post triangle thrust down was approximately twice the size of the widest part of the triangle from October to December 2018. If the RUT has completed a Horizontal Triangle, a post triangle thrust up is just what to expect at this stage of the bull market. Typically, late term bull markets have surges among the small cap stocks. This phenomenon occurs because traders/investors are looking for bargains, as most of the quality companies' stocks have already had extended rallies. Late stage small cap stock rallies almost always top out before the large cap indices. |
|
| Figure 3. The small cap Russell 2000 (RUT) also appears to have formed a Horizontal Triangle from its September 2018 top. |
| Graphic provided by: BigCharts.com. |
| |
| The Big Picture My February 1, 2018 article "How High is Up?" noted that the S&P 500 (SPX) could find major Fibonacci resistance at 3047. On July 12, 2019 the SPX reached 3013, only 34 points from the long-standing target. My June 28, 2019 article illustrated Fibonacci evidence that SPX 3300 could be an alternative resistance target. My July 11, 2019 article, "Buy High, Sell Higher", listed three stocks, Facebook, Amazon.com, and Netflix that could soon hit "Cup with Handle" buy entry points. Facebook and Amazon.com have since reached their buy points and could be in the early phase of a multi-week rallies. With the additional evidence that the DJTA and RUT may have completed multi-month Horizontal Triangle corrections, the probabilities have increased that the SPX could move significantly above 3047. When analyzing any market or stock you must look at the weight of the evidence to determine probable direction. Avoid over reliance on any one indicator, even if that indicator has been used for over a century. The current double bearish divergence signal of the DJTA to DJIA based upon the weight of evidence is probably a false signal. Should the classic Dow Theory DJTA to DJIA relationship be thrown out of the technical analysis toolbox? No, it just needs to be put in the proper context of a twenty-first century market and economy. Further Reading: Russell Richard (1958-59-60 - Copyright Barron's) "The Dow Theory Today" Fraser Publishing Company Edition 1981. Frost A.J and Robert Prechter (1985) "Elliott Wave Principle", New Classics Library. |
Independent investment advisor, trader and writer. He has written articles for Technical Analysis of Stocks & Commodities, Traders.com Advantage,Futuresmag.com and, Finance Magnates. Author of website Four Dimension Trading.
| Website: | www.fourdimensiontrading.com |
| E-mail address: | markrivest@gmail.com |
Click here for more information about our publications!
PRINT THIS ARTICLE

Request Information From Our Sponsors
- StockCharts.com, Inc.
- Candle Patterns
- Candlestick Charting Explained
- Intermarket Technical Analysis
- John Murphy on Chart Analysis
- John Murphy's Chart Pattern Recognition
- John Murphy's Market Message
- MurphyExplainsMarketAnalysis-Intermarket Analysis
- MurphyExplainsMarketAnalysis-Visual Analysis
- StockCharts.com
- Technical Analysis of the Financial Markets
- The Visual Investor
- VectorVest, Inc.
- Executive Premier Workshop
- One-Day Options Course
- OptionsPro
- Retirement Income Workshop
- Sure-Fire Trading Systems (VectorVest, Inc.)
- Trading as a Business Workshop
- VectorVest 7 EOD
- VectorVest 7 RealTime/IntraDay
- VectorVest AutoTester
- VectorVest Educational Services
- VectorVest OnLine
- VectorVest Options Analyzer
- VectorVest ProGraphics v6.0
- VectorVest ProTrader 7
- VectorVest RealTime Derby Tool
- VectorVest Simulator
- VectorVest Variator
- VectorVest Watchdog