HOT TOPICS LIST
- MACD
- Fibonacci
- RSI
- Gann
- ADXR
- Stochastics
- Volume
- Triangles
- Futures
- Cycles
- Volatility
- ZIGZAG
- MESA
- Retracement
- Aroon
INDICATORS LIST
LIST OF TOPICS
PRINT THIS ARTICLE
by Mark Rivest
See the factors needed to buy stocks at, or near, their highs.
Position: N/A
Mark Rivest
Independent investment advisor, trader and writer. He has written articles for Technical Analysis of Stocks & Commodities, Traders.com Advantage,Futuresmag.com and, Finance Magnates. Author of website Four Dimension Trading.
PRINT THIS ARTICLE
CUP WITH HANDLE
Buy High, Sell Higher
07/11/19 04:39:58 PMby Mark Rivest
See the factors needed to buy stocks at, or near, their highs.
Position: N/A
| Many stock traders/investors believe that the greatest success can be achieve from buying stocks at or near their lows. Contrary to popular belief, the probabilities of a successful trade are increased when buying at or near a stock's high. The trick is knowing what conditions are needed to place the trade. Buy High Theory The two most important factors when buying stocks are: 1) find stocks that are outperforming or matching the broader market, 2) buy when the stock has at least reached a six-month high. If you go long a stock at, or near, the low of a multi month decline, there's probably something wrong with the company, or worse, the broader market is in a decline because of a weakening economy. The best time to buy stocks is during a bull market and to focus on stocks that are close to, or at, new highs. These are usually companies with the strongest fundamentals and greatest growth potential. In the early 1960's Nicolas Darvas revealed his system for stock selection in "How I Made $2,000,000 in the Stock Market". Central to his success was purchasing stocks at, or near, their highs. Later William O'Neil expanded on this concept with his CANSLIM theory illustrated in ""How to Make Money in Stocks" and in "Investor's Business Daily". Recently, Investor's Business Daily illustrated three market leading stocks (Facebook Inc. (FB), Amazon.Com (AMZN) and Netflix Inc. (NFLX)) that are approaching buy points. |

|
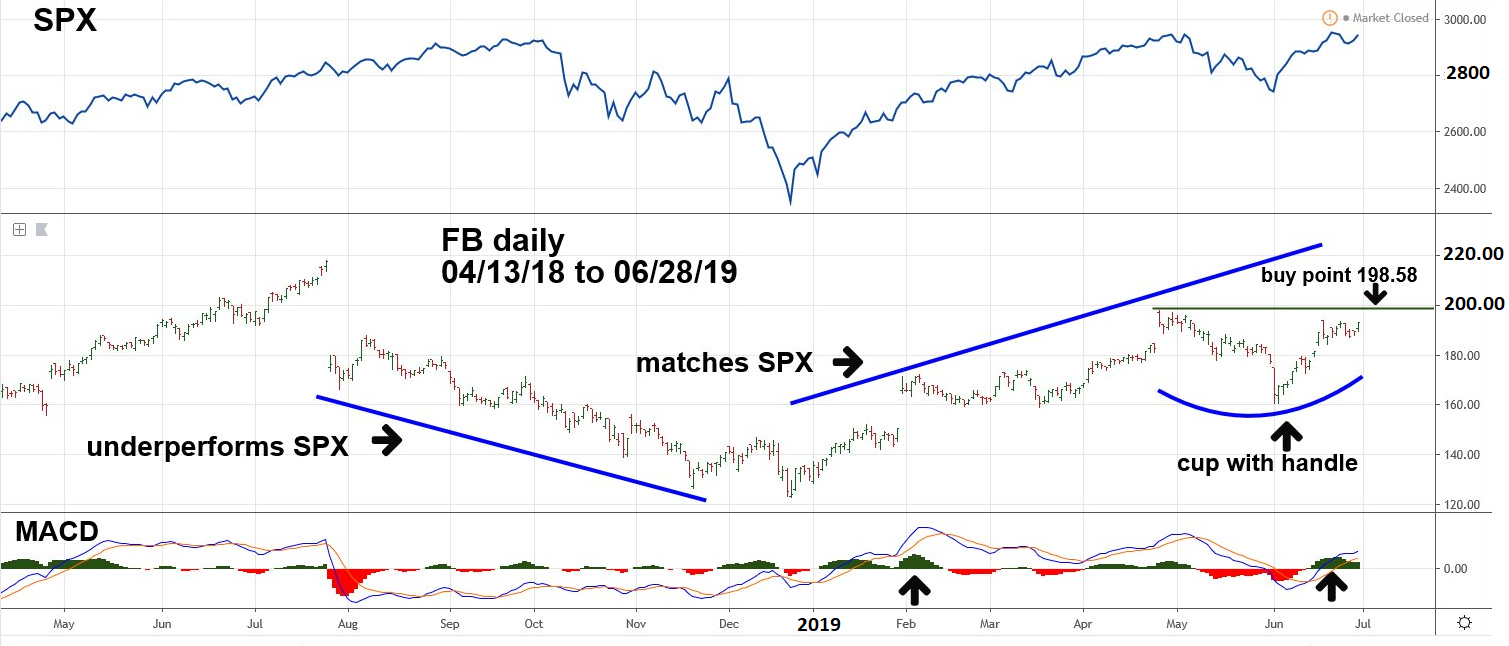
| Figure 1. The point to go long a stock is .10 above the cups high point, which in this case is 198.58. |
| Graphic provided by: TradingView. |
| |
| Facebook Please see the daily Facebook (FB) chart illustrated in Figure 1. Note that in 2018 (FB) hit its top more than a month before the S&P 500 (SPX) hit its high. You want to avoid stocks that are underperforming the broader market, especially if the stock was a prior market leader. They usually lead the way down, which is what happened with FB. In late November FB was marginally more bullish than the SPX. They both bottomed in late December and since then FB has matched the performance of the SPX. The subsequent correction is called a Cup with Handle and is one of the elements of the CANSLIM method. Based on this methodology the point to go long a stock is .10 above the cup's high point, which in this case is 198.58. The MACD Histogram is a good confirming indicator; note that on the most recent rally the Histogram is a at a relatively high level, hinting that there could be more price rally as Histogram diverges. |

|
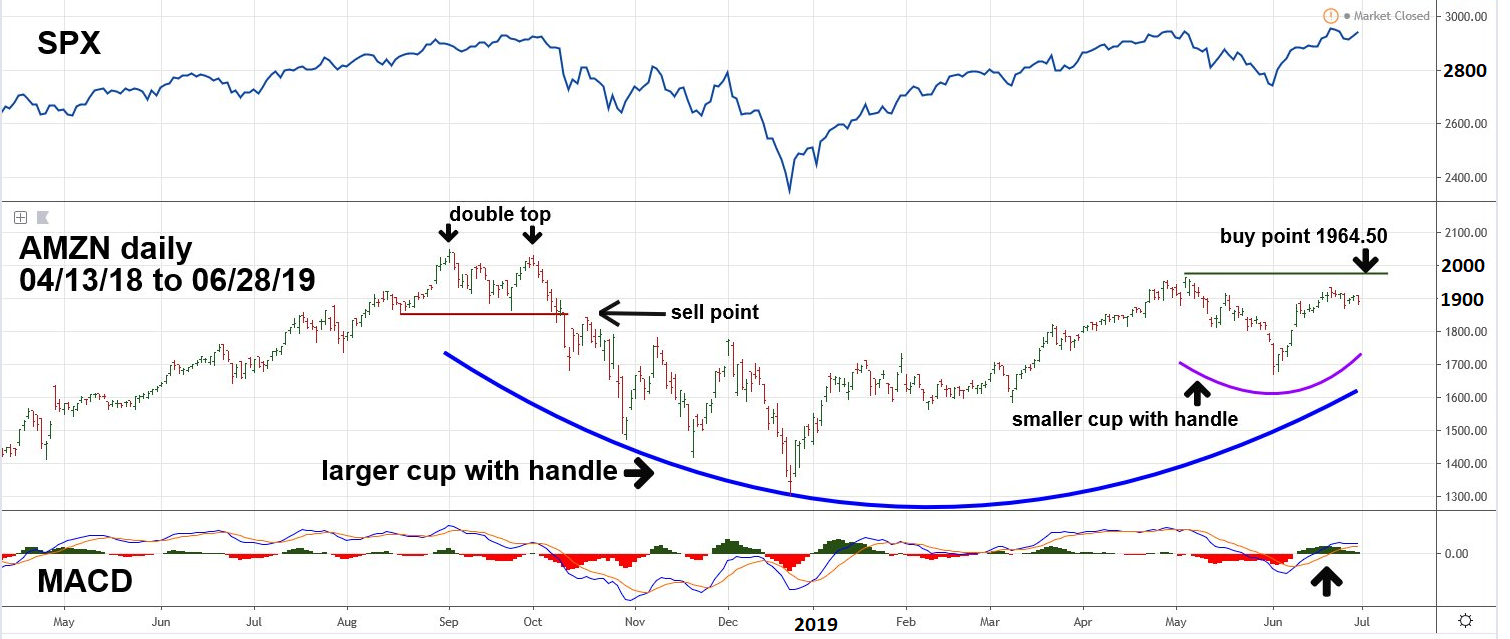
| Figure 2. In September/October AMZN had a double top then broke below a double bottom; a clear sign the stock could be headed lower. |
| Graphic provided by: TradingView. |
| |
| Amazon.com Please see the daily Amazon.Com (AMZN) chart illustrated in Figure 2. In September/October AMZN had a double top then broke below a double bottom; a clear sign the stock could be headed lower. Since this was a prior bull market leader it was a bearish signal for the US stock market. The subsequent decline and rally since late December are a large Cup with Handle, followed by a smaller Cup with Handle. The buy entry point is based on the high of the smaller formation. |

|
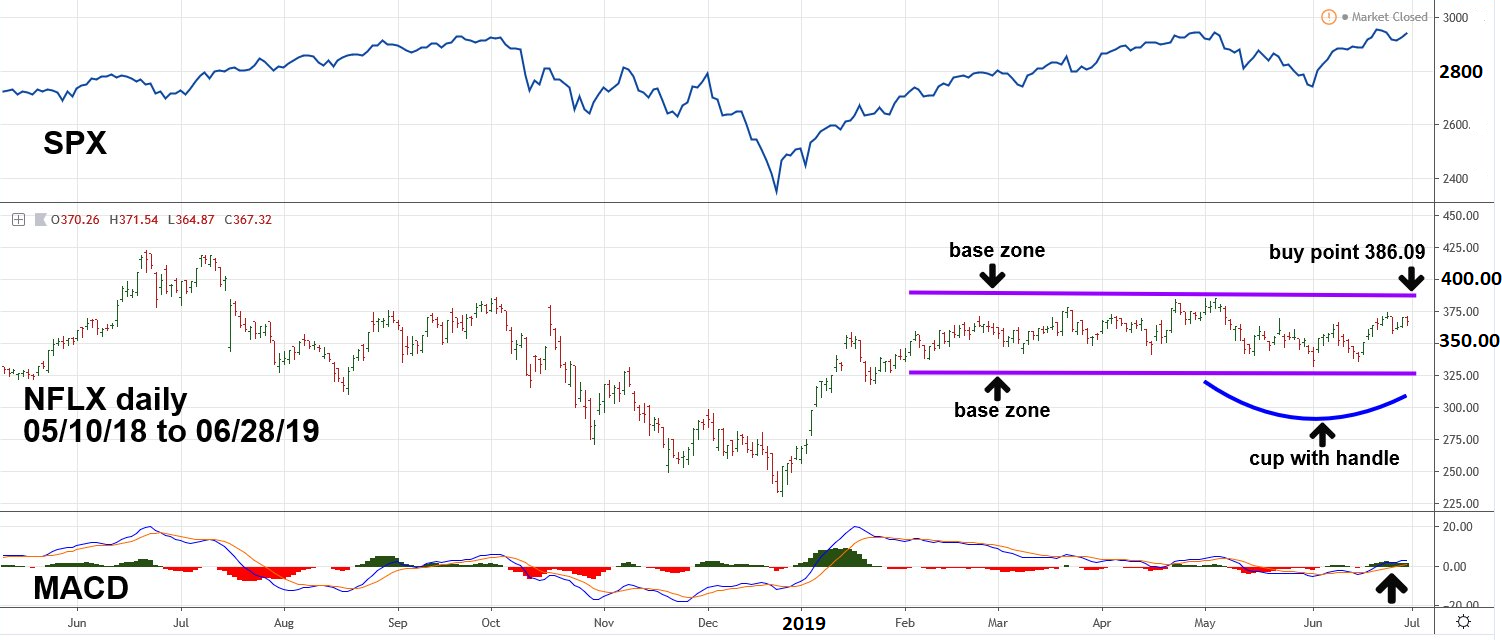
| Figure 3. Usually the size of the base has implications to the subsequent break below or above the base. |
| Graphic provided by: TradingView. |
| |
| Netflix Please see the daily Netflix (NFLX) chart illustrated in Figure 3. What's very interesting about NFLX is not only does it have a Cup with Handle pattern, but there's also a larger basing formation that stretches all the way back to February. Usually the size of the base has implications to the subsequent break below, or above, the base. The larger the base the bigger the move outside of the base. Perhaps if NFLX's buy point at 386.09 is triggered there could be an enormous rally. |
| Using Stocks As Market Indicators Perhaps you have no interest in buying FB, AMZN, and NFLX, but they still should be followed as stock market indicators. For several years all these stocks have been important market leaders. What happens to them could have consequences for other US stocks, even the entire global stock market. My June 28 article "Setting Trading Targets" noted the SPX could soon reach 3047 and possibly reach 3300. The bullish formations of FB, AMZN and NFLX tie-in directly with the broader stock market analysis. A bearish break in even one of these stocks could be the first sign of a developing multi-month global stock market decline. Keep watching and be prepared. Further Reading: Darvas Nicolas (1971) "How I Made $2,000,000 in the Stock Market" Lyle Stuart Inc. O'Neil J. William (2009) "How to Make Money in Stocks", McGraw-Hill Investor's Business Daily www.investors.com Mark Rivest |
Independent investment advisor, trader and writer. He has written articles for Technical Analysis of Stocks & Commodities, Traders.com Advantage,Futuresmag.com and, Finance Magnates. Author of website Four Dimension Trading.
| Website: | www.fourdimensiontrading.com |
| E-mail address: | markrivest@gmail.com |
Click here for more information about our publications!
PRINT THIS ARTICLE

Request Information From Our Sponsors
- StockCharts.com, Inc.
- Candle Patterns
- Candlestick Charting Explained
- Intermarket Technical Analysis
- John Murphy on Chart Analysis
- John Murphy's Chart Pattern Recognition
- John Murphy's Market Message
- MurphyExplainsMarketAnalysis-Intermarket Analysis
- MurphyExplainsMarketAnalysis-Visual Analysis
- StockCharts.com
- Technical Analysis of the Financial Markets
- The Visual Investor
- VectorVest, Inc.
- Executive Premier Workshop
- One-Day Options Course
- OptionsPro
- Retirement Income Workshop
- Sure-Fire Trading Systems (VectorVest, Inc.)
- Trading as a Business Workshop
- VectorVest 7 EOD
- VectorVest 7 RealTime/IntraDay
- VectorVest AutoTester
- VectorVest Educational Services
- VectorVest OnLine
- VectorVest Options Analyzer
- VectorVest ProGraphics v6.0
- VectorVest ProTrader 7
- VectorVest RealTime Derby Tool
- VectorVest Simulator
- VectorVest Variator
- VectorVest Watchdog
