HOT TOPICS LIST
- MACD
- Fibonacci
- RSI
- Gann
- ADXR
- Stochastics
- Volume
- Triangles
- Futures
- Cycles
- Volatility
- ZIGZAG
- MESA
- Retracement
- Aroon
INDICATORS LIST
LIST OF TOPICS
PRINT THIS ARTICLE
by Mark Rivest
Guidelines for primary and alternate targets.
Position: N/A
Mark Rivest
Independent investment advisor, trader and writer. He has written articles for Technical Analysis of Stocks & Commodities, Traders.com Advantage,Futuresmag.com and, Finance Magnates. Author of website Four Dimension Trading.
PRINT THIS ARTICLE
FIBONACCI
Setting Trading Targets
06/28/19 04:06:50 PMby Mark Rivest
Guidelines for primary and alternate targets.
Position: N/A
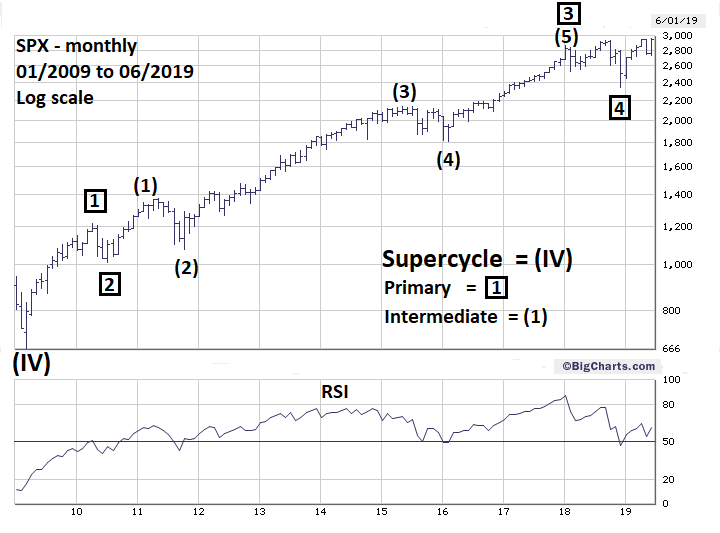
| Technical analysis helps traders to define targets where a market or stock could be heading towards. Sometimes the targets aren't reached or exceeded. When this happens critics of technical analysis reply that the methodology is a failure. The skeptics expect perfection, which can't be achieved because markets, like individuals, can and will change their minds. Traders need to have alternate and primary targets to be prepared for the unexpected. S&P 500 Monthly Fibonacci retrace/extension points are like magnets drawing markets and stocks towards them, and after being reached they can become barriers. The further away Fibonacci points are from their origin the greater the power. Drawing power can also be increased when two or more Fibonacci points are close together. My February 1, 2018 article "How High is Up" noted the next significant Fibonacci resistance was at SPX 3047. This is calculated by taking the 909.30 points of the 2007 to 2009 decline multiplied by the Fibonacci extension ratio of 2.618, which equals 2380.54, which when added to the March 2009 bottom at 666.79 yields a target of 3047.33. Using the next highest Fibonacci extension of 3.00 derives a potential target of SPX 3394. To find if there are any other potential targets, we need to examine the SPX Elliott wave structure from the March 2009 bottom. Please see the Monthly S&P 500 (SPX) chart illustrated in Figure 1. It appears the SPX could be in the fifth Primary wave up from the major bottom made in 2009. If so, the rally that began in December 2018 could be the termination phase of a ten- year secular bull market. Usually within a five wave Elliott Impulsive pattern there's a relationship between waves "one" and "five" of either equality or 50%. The supposed Primary wave "1" from SPX 666 to 1218 gained 82.9% — multiplied by 50% equals 41.4%. Applying a growth rate of 41.4% to the supposed Primary wave "4" bottom made in December 2018 at 2346.60 yields a target of 3318.10. A second confirming Fibonacci calculation can be found by taking the September to December 2018 decline of 594.30 points multiplied by the Fibonacci extension ratio of 1.618 which equals 961.60 points, which when added to the low of 2346.60 targets 3308.20. Using this same technique with the May to June 2019 decline of 225.30 points multiplied by 2.618 equals 589.80 points, which when added to the June 3, 2019 bottom of 2728.80 yields 3318.60. Three Fibonacci targets close together indicates the SPX could be drawn to the low 3300 area. |

|
| Figure 1. Three Fibonacci targets close together indicates the SPX could be drawn to the low 3300 area. |
| Graphic provided by: BigCharts.com. |
| |
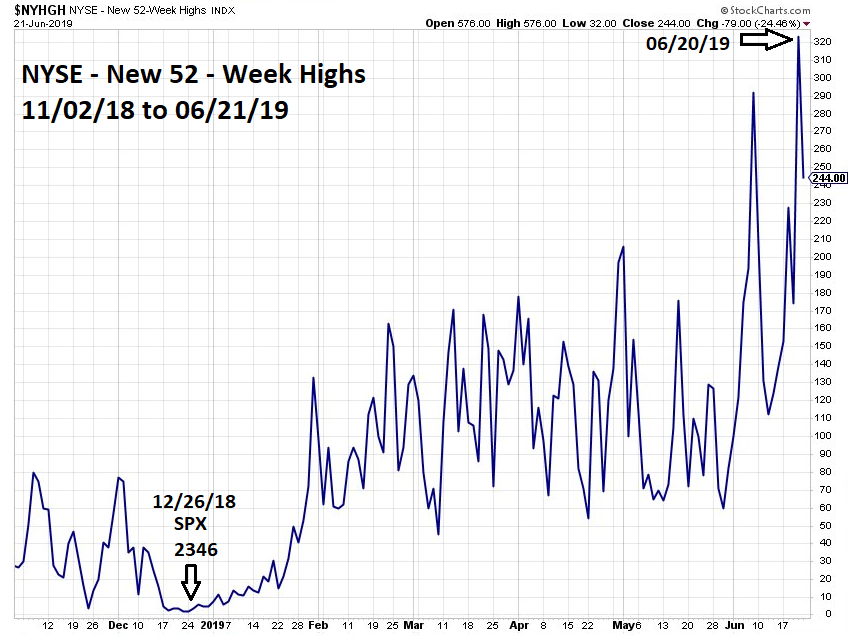
| Momentum Evidence When the SPX broke out to a new all-time high on June 20, 2019 it was accompanied by the highest number of new NYSE 52-week highs since the current bull phase began on December 26, 2018. Please see the NYSE 52-week high chart illustrated in Figure 2. The SPX new high was confirmed by the new NYSE 52-week highs. Assuming this could be the maximum level of NYSE highs, it implies the SPX could rally several weeks against diverging new 52-week highs. |

|
| Figure 2. The SPX new high was confirmed by the new NYSE 52–week highs. |
| Graphic provided by: StockCharts.com. |
| |
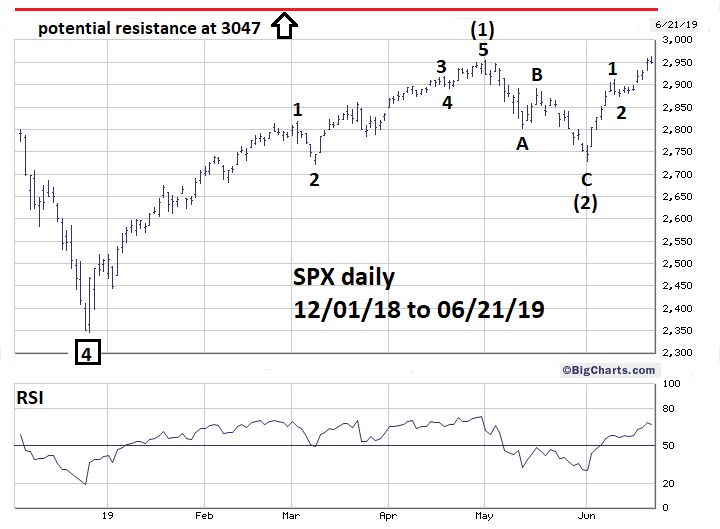
| S&P 500 Daily Please see the SPX daily chart illustrated in Figure 3. If the supposed wave count is correct it means the SPX is in the early part of Minor wave "3" of Intermediate wave "(3)" up from the late December 2018 bottom. The third of a third wave is usually the most dynamic and powerful sub wave of a developing larger degree five wave pattern. This is exactly the type of price action that occurs with a surge in new 52-week highs. A dynamic price move would also be aligned with the 1987 bull market analogy noted in my June 20 article, "Ghost of Bull Market Past". If a steady relentless move up occurs the SPX could sail past the potential resistance at 3047 without much hesitation. |

|
| Figure 3. If a steady relentless move up occurs the SPX could sail past the potential resistance at 3047 without much hesitation. |
| Graphic provided by: BigCharts.com. |
| |
| Be Prepared One of the worst things a trader can do is fall in love with a forecast. No matter how good your method is, there's no perfection. Plan for alternate action and price levels. The SPX analogy with the 1987 bull market does not allow for much leeway, so price needs to rise steadily between late June and mid-August 2019. If price stalls near SPX 3050 there's the potential for a significant downside reversal. Traders, we live in a world of probabilities not certainties. Maintain mental flexibility, as the greatest traders are the greatest opportunists. Further Reading: Frost A.J and Robert Prechter (1985) "Elliott Wave Principle", New Classics Library. |
Independent investment advisor, trader and writer. He has written articles for Technical Analysis of Stocks & Commodities, Traders.com Advantage,Futuresmag.com and, Finance Magnates. Author of website Four Dimension Trading.
| Website: | www.fourdimensiontrading.com |
| E-mail address: | markrivest@gmail.com |
Click here for more information about our publications!
PRINT THIS ARTICLE

Request Information From Our Sponsors
- StockCharts.com, Inc.
- Candle Patterns
- Candlestick Charting Explained
- Intermarket Technical Analysis
- John Murphy on Chart Analysis
- John Murphy's Chart Pattern Recognition
- John Murphy's Market Message
- MurphyExplainsMarketAnalysis-Intermarket Analysis
- MurphyExplainsMarketAnalysis-Visual Analysis
- StockCharts.com
- Technical Analysis of the Financial Markets
- The Visual Investor
- VectorVest, Inc.
- Executive Premier Workshop
- One-Day Options Course
- OptionsPro
- Retirement Income Workshop
- Sure-Fire Trading Systems (VectorVest, Inc.)
- Trading as a Business Workshop
- VectorVest 7 EOD
- VectorVest 7 RealTime/IntraDay
- VectorVest AutoTester
- VectorVest Educational Services
- VectorVest OnLine
- VectorVest Options Analyzer
- VectorVest ProGraphics v6.0
- VectorVest ProTrader 7
- VectorVest RealTime Derby Tool
- VectorVest Simulator
- VectorVest Variator
- VectorVest Watchdog
