

HOT TOPICS LIST
- MACD
- Fibonacci
- RSI
- Gann
- ADXR
- Stochastics
- Volume
- Triangles
- Futures
- Cycles
- Volatility
- ZIGZAG
- MESA
- Retracement
- Aroon
INDICATORS LIST
LIST OF TOPICS
PRINT THIS ARTICLE
by Mark Rivest
Analogy with 1987 bull market implies US stocks could rally until August 2019. The S&P 500 (SPX) rally from December 26, 2018 to May 1, 2019 resembles the SPX December 31, 1986 to April 7, 1987 ascent. If the analogy continues, the SPX could reach 3300 by late August or early September 2019.
Position: N/A
Mark Rivest
Independent investment advisor, trader and writer. He has written articles for Technical Analysis of Stocks & Commodities, Traders.com Advantage,Futuresmag.com and, Finance Magnates. Author of website Four Dimension Trading.
PRINT THIS ARTICLE
MARKET TIMING
Ghost Of Bull Market Past
06/20/19 04:46:49 PMby Mark Rivest
Analogy with 1987 bull market implies US stocks could rally until August 2019. The S&P 500 (SPX) rally from December 26, 2018 to May 1, 2019 resembles the SPX December 31, 1986 to April 7, 1987 ascent. If the analogy continues, the SPX could reach 3300 by late August or early September 2019.
Position: N/A
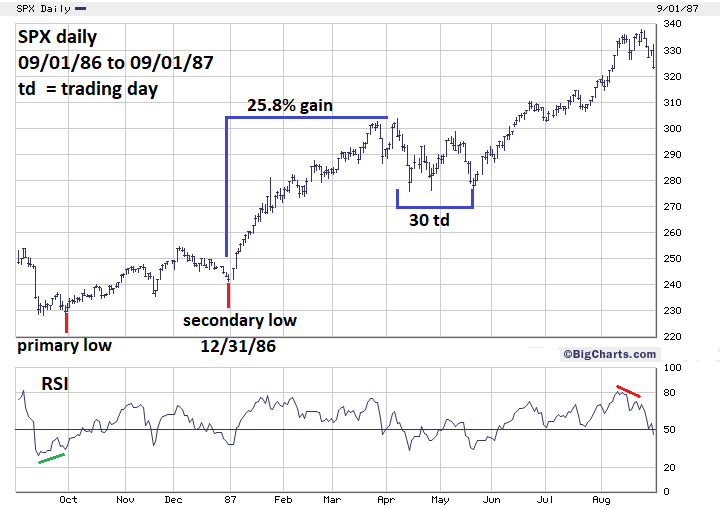
| S&P 500 - 1986 to 1987 The stock market is like the weather, both have repeatable patterns and can be forecasted. The length and intensity of a storm can be predicted by comparing current conditions with data of prior atmospheric disturbances. My February 7, 2019 article "Using History to Forecast the Future" noted that the SPX October to December 2018 decline was very similar to the SPX July to October 1998 drop. The SPX bull market from late 1986 to August 1987 could be repeating in 2019. Please see the SPX daily chart 1986 to 1987 illustrated in Figure 1. The US stock market made a major bottom in August 1982 and began a bull market. In July 1986 an intermediate peak was made followed by a correction which bottomed in late September 1986. The main thrust of the next bull move began on December 31, 1986. Sometimes markets will begin a dynamic thrust near the turn of a new year. A classic example is Japan's Nikkei 225 stock market index which began a major bear market at the start of 1990. The SPX and the broad US stock market began a powerful move up on December 31, 1986 that lasted until April 7, 1987 resulting in a gain of 25.8%. The subsequent correction lasted 30 trading days followed by a rally that ended in late August 1987. |
|
| Figure 1. The SPX and the broad US stock market began a powerful move up on the December 31, 1986 that lasted until April 7, 1987 a gain of 25.8%. |
| Graphic provided by: BigCharts.com. |
| |
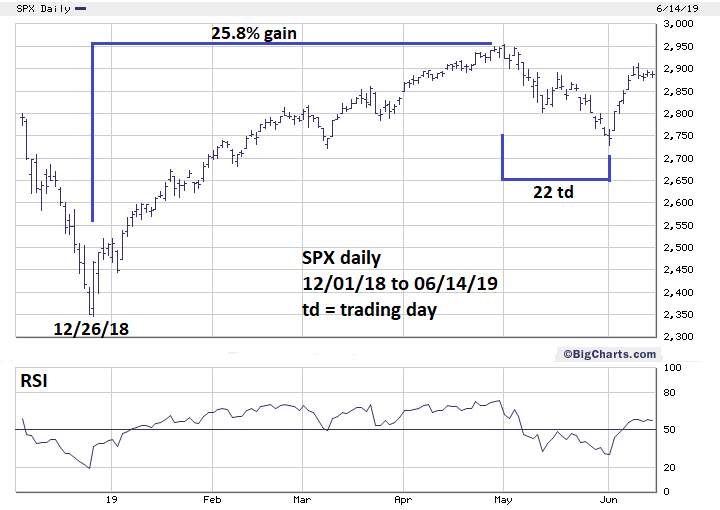
| S&P 500 - 2018 to 2019 Please see the SPX daily chart 2018 to 2019 illustrated in Figure 2. Again, we see a powerful thrust on the cusp of the new year. This time the rally lasted a little longer than the 1986 to 1987 move. However, the gain was the same, 25.8% from the late year bottom. The subsequent decline has so far been 22 trading days. My article "Discovering Support Levels - Part Two" using data as of May 24 speculated that the SPX could bottom on May 31 and make a low in the range of 2693 to 2725. This forecast was based upon a Fibonacci time cycle of 21 trading days after the May 1 top and the Point and Figure maximum value zone of 2693 to 2725. A bottom was made at 2728 on June 3 — new moon day. The powerful move up after brushing against maximum value looks very much like the kickoff phase of a new multi-week rally. The so far shallow and narrow correction after the rally to SPX 2910 adds evidence that a strong rally could be underway. |
|
| Figure 2. The powerful move up after brushing against maximum value looks very much like the kickoff phase of a new multi�week rally. |
| Graphic provided by: BigCharts.com. |
| |
| Forecast to August 2019 From late December 1986 to late August 1987 the SPX rallied 40%. A 40% rally from the SPX December 26, 2018 bottom at 2346 targets 3285. The SPX September to December 2018 decline was 594 points multiplied by the Fibonacci extension ratio 1.618 is 961 points added to 2346 targets SPX 3307. The SPX late May 1987 to the August 25, 1987 top was about 22%. A 22% rally from the SPX June 3, 2019 bottom of 2728 targets 3328 by late August or early September 2019. One factor that could change the forecast is the FOMC announcement due on June 19. If on June 20 or a few trading days later, the SPX is trading above the recent short-term peak of 2910, there's a high probability the rally could continue for several weeks. If the SPX and the broader US stock market declines on the FOMC announcement and continues declining into early July, it could be part of a larger developing down move. If the SPX can reach 3300 by late August early September 2019 does that mean a 1987 size crash could be next? Let's hold off on that speculation. One forecast at a time. First see if the SPX can get above the all-time high of 2954, which is just the first of several upside barriers the SPX must overcome. Further Reading: Dalton James. F, Jones Eric. T & Dalton Robert. B (1993) "Mind Over Markets" Traders Press, Inc. |
Independent investment advisor, trader and writer. He has written articles for Technical Analysis of Stocks & Commodities, Traders.com Advantage,Futuresmag.com and, Finance Magnates. Author of website Four Dimension Trading.
| Website: | www.fourdimensiontrading.com |
| E-mail address: | markrivest@gmail.com |
Click here for more information about our publications!
PRINT THIS ARTICLE

Request Information From Our Sponsors
- StockCharts.com, Inc.
- Candle Patterns
- Candlestick Charting Explained
- Intermarket Technical Analysis
- John Murphy on Chart Analysis
- John Murphy's Chart Pattern Recognition
- John Murphy's Market Message
- MurphyExplainsMarketAnalysis-Intermarket Analysis
- MurphyExplainsMarketAnalysis-Visual Analysis
- StockCharts.com
- Technical Analysis of the Financial Markets
- The Visual Investor
- VectorVest, Inc.
- Executive Premier Workshop
- One-Day Options Course
- OptionsPro
- Retirement Income Workshop
- Sure-Fire Trading Systems (VectorVest, Inc.)
- Trading as a Business Workshop
- VectorVest 7 EOD
- VectorVest 7 RealTime/IntraDay
- VectorVest AutoTester
- VectorVest Educational Services
- VectorVest OnLine
- VectorVest Options Analyzer
- VectorVest ProGraphics v6.0
- VectorVest ProTrader 7
- VectorVest RealTime Derby Tool
- VectorVest Simulator
- VectorVest Variator
- VectorVest Watchdog