

HOT TOPICS LIST
- MACD
- Fibonacci
- RSI
- Gann
- ADXR
- Stochastics
- Volume
- Triangles
- Futures
- Cycles
- Volatility
- ZIGZAG
- MESA
- Retracement
- Aroon
INDICATORS LIST
LIST OF TOPICS
PRINT THIS ARTICLE
by Mark Rivest
See how the S&P 500 in 1998 could give clues to 2019.
Position: Buy
Mark Rivest
Independent investment advisor, trader and writer. He has written articles for Technical Analysis of Stocks & Commodities, Traders.com Advantage,Futuresmag.com and, Finance Magnates. Author of website Four Dimension Trading.
PRINT THIS ARTICLE
MARKET TIMING
Using History To Forecast The Future
02/07/19 04:27:13 PMby Mark Rivest
See how the S&P 500 in 1998 could give clues to 2019.
Position: Buy
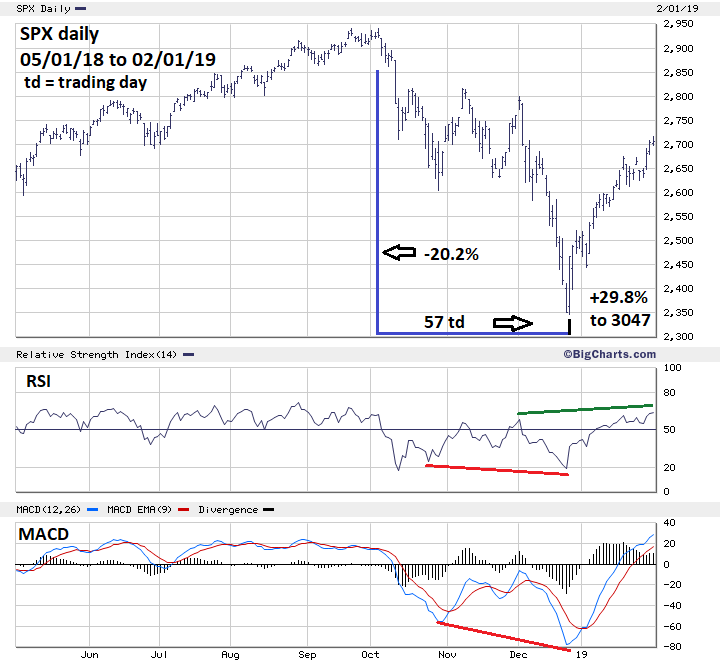
| Traders and analysts need to be market historians. Whatever time scale you're trading, a market at some point will repeat itself, sometimes with amazing accuracy. In the third quarter of 1998 the S&P 500 (SPX) had a decline very similar to the late 2018 drop and could forecast SPX action in 2019. S&P 500 - 2018 to 2019 Markets tend to be drawn to round numbers and Fibonacci support/resistance points. For the SPX in early 2019 there are two points it can gravitate: The first is 3000, the second is 3047 - a major Fibonacci coordinate. SPX 3047 was first discussed in my February 1, 2018 article "How High is Up" and is calculated by taken the length of the SPX 2007 to 2009 decline of 909.30 points, then multiplied by the Fibonacci ratio of 2.618, which yields 2380.54. Adding this to the SPX 2009 bottom of 666.79 targets 3047.33 as a possibly rally termination point. Please see the SPX daily chart 2018 to 2019 illustrated in Figure 1. Since the December 26 bottom the SPX has had a robust rally. On February 1 the daily RSI reached its highest point, confirming the price rally high. In stock market rallies the RSI almost always has at least one bearish divergence before a significant top can be made. Additionally, there's an RSI bullish divergence vs. the RSI top made when the SPX was at 2800, forecasting a move up to at least that level. On February 1 the SPX high was 2716, just above the .618 retracement of the October to December decline, which is 2713. This is within the leeway as possible Fibonacci resistance. If the SPX can get above 2740 it could open the door for a rally back to the all-time high of 2940. The US stock market is seasonally bullish until May. The ten-year anniversary of the secular bull market is March 2019. Can the SPX reach the area of 3047 by March 2019? Historical evidence says there's a good chance. |
|
| Figure 1. The US stock market is seasonally bullish until May. The ten-year anniversary of the secular bull market is March 2019. |
| Graphic provided by: BigCharts.com. |
| |
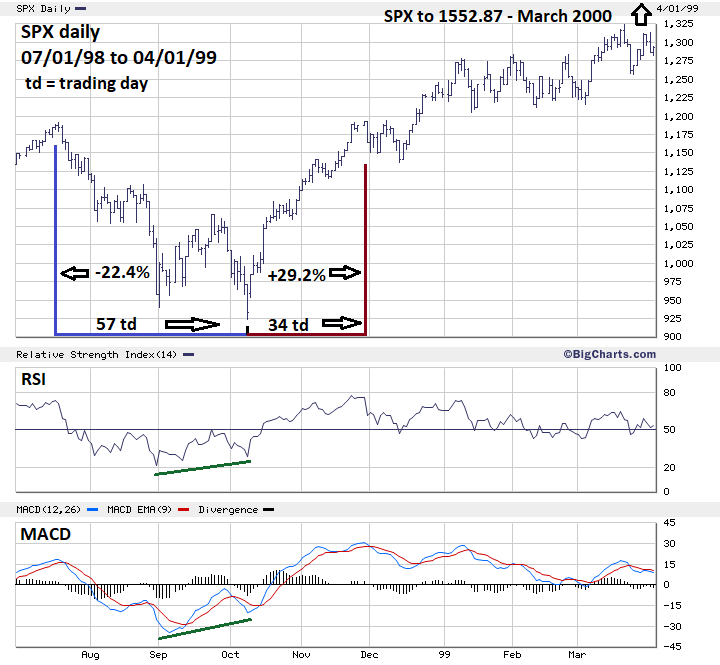
| S&P 500 - 1998 to 1999 Please see the daily SPX chart 1998 to 1999 in Figure 2. The 1998 SPX correction was very similar to the 2018 decline. Fifty-seven trading days after the SPX July 1998 all-time high the correction ended. On Oct 3, 2018 the Dow Jones Industrial Average was the last of the three main US stock indices to make an all-time high. The SPX on October 3 made a marginally lower secondary top. Fifty-seven trading days later a bottom was in place. The 1998 decline was 22.4% vs. the 2018 drop of 20.2%. The rally following the October 8, 1998 bottom was spectacular. In thirty-four trading days the SPX was able to make a marginal new all-time high. If the SPX in 2019 was to repeat the 29.2% gain from the 2346 bottom it would reach 3031 near long-term Fibonacci resistance at 3047. Also, thirty-four trading days after the SPX December 26, 2018 bottom targets February 15, only two weeks before the ten-year bull market anniversary. |
|
| Figure 2. If the SPX in 2019 was to repeat the 29.2% gain from the 2346 bottom it would reach 3031, near long-term Fibonacci resistance at 3047. |
| Graphic provided by: BigCharts.com. |
| |
| Differences Between 1998 and 2018 The SPX 1998 correction bottomed in October and subsequently was able to take full advantage of the November to May bullish seasonal pattern. The SPX 2018 decline bottomed in December, so the reduced bullish season could restrain the rallies potential. In 1998 both the daily RSI and MACD had significant bullish divergences at the October bottom. Typically, a rally's potential is increased with bullish momentum divergences. The 2018 SPX bottom had no bullish divergences — these types of bottoms typically have weaker rallies. Think of evidence at market turns as fuel for the subsequent reversal. The more evidence at a turn means more fuel and greater upside or downside potential. The bottom in October 1998 had much more bullish evidence than the December 2018 bottom and was able to rally far above the prior all-time high made in July 1998. It's doubtful the rally after December 2018 will have as great of potential as the 1998 to 2000 rally. Reaching the SPX zone of 3030 to 3060 could be all the current rally can produce. One final note on the SPX 1998 correction and the use of Fibonacci Extensions to project a market top. The 1998 SPX correction was 267.26 points x 2.382 = 636.61 + Oct 1998 bottom of 923.32 targets 1559.93. The ultimate SPX peak in March of 2000 was 1552.87. That extension was able to target a major SPX turning point. Perhaps the Fibonacci extension using the 2007 to 2009 decline targeting SPX 3047 could be the next major turning point. Further Reading: Frost A.J and Robert Prechter (1985) "Elliott Wave Principle", New Classics Library. |
Independent investment advisor, trader and writer. He has written articles for Technical Analysis of Stocks & Commodities, Traders.com Advantage,Futuresmag.com and, Finance Magnates. Author of website Four Dimension Trading.
| Website: | www.fourdimensiontrading.com |
| E-mail address: | markrivest@gmail.com |
Click here for more information about our publications!
Comments
Date:�02/20/19Rank:�3Comment:�

Request Information From Our Sponsors
- StockCharts.com, Inc.
- Candle Patterns
- Candlestick Charting Explained
- Intermarket Technical Analysis
- John Murphy on Chart Analysis
- John Murphy's Chart Pattern Recognition
- John Murphy's Market Message
- MurphyExplainsMarketAnalysis-Intermarket Analysis
- MurphyExplainsMarketAnalysis-Visual Analysis
- StockCharts.com
- Technical Analysis of the Financial Markets
- The Visual Investor
- VectorVest, Inc.
- Executive Premier Workshop
- One-Day Options Course
- OptionsPro
- Retirement Income Workshop
- Sure-Fire Trading Systems (VectorVest, Inc.)
- Trading as a Business Workshop
- VectorVest 7 EOD
- VectorVest 7 RealTime/IntraDay
- VectorVest AutoTester
- VectorVest Educational Services
- VectorVest OnLine
- VectorVest Options Analyzer
- VectorVest ProGraphics v6.0
- VectorVest ProTrader 7
- VectorVest RealTime Derby Tool
- VectorVest Simulator
- VectorVest Variator
- VectorVest Watchdog