

HOT TOPICS LIST
- MACD
- Fibonacci
- RSI
- Gann
- ADXR
- Stochastics
- Volume
- Triangles
- Futures
- Cycles
- Volatility
- ZIGZAG
- MESA
- Retracement
- Aroon
INDICATORS LIST
LIST OF TOPICS
PRINT THIS ARTICLE
by Mark Rivest
What are the consequences if the S&P 500 breaks below important support?
Position: N/A
Mark Rivest
Independent investment advisor, trader and writer. He has written articles for Technical Analysis of Stocks & Commodities, Traders.com Advantage,Futuresmag.com and, Finance Magnates. Author of website Four Dimension Trading.
PRINT THIS ARTICLE
MARKET PROFILE
Discovering Support Levels - Part Two
06/06/19 03:41:12 PMby Mark Rivest
What are the consequences if the S&P 500 breaks below important support?
Position: N/A
| Fibonacci analysis indicates that the S&P 500 (SPX) could have strong support at 2722. Point and figure charting confirms 2693 to 2725 could be a bottoming zone. US stocks are seasonally bearish until November and the world's two largest economies are in a trade war. The SPX low 2700 area could be the site of a gigantic bull and bear battle. If the bulls win, new all-time highs could be made in just a few weeks. A bear victory opens the door to a rapid smash down to 2400. Point And Figure Chart The SPX March 8 minor correction bottom also corresponds with a Fibonacci .382 retracement of the December to May rally. My May 16 article, "Discovering Support Levels", noted a possible false break below SPX 2722 could occur. Using point and figure charting explains why there could be leeway down to 2693. Point and figure (PF) charts do not plot price against time like time-based charts. Instead, they plot price against changes in direction by plotting a column of X's as price rises and a column of O's as price falls. Please see the SPX point and figure chart illustrated in Figure 1. This is an update of the PF chart shown in my May 9 article, "On an All Time High". At the time SPX looked poised to move above resistance and form a new rising stem, instead the breakout was marginal. Markets will move either away from or towards value. Market Profile methodology defines value as the area with the greatest price overlap, which on the SPX PF chart is the string of X's and O's 2693 to 2725, also referred to as point of control. |
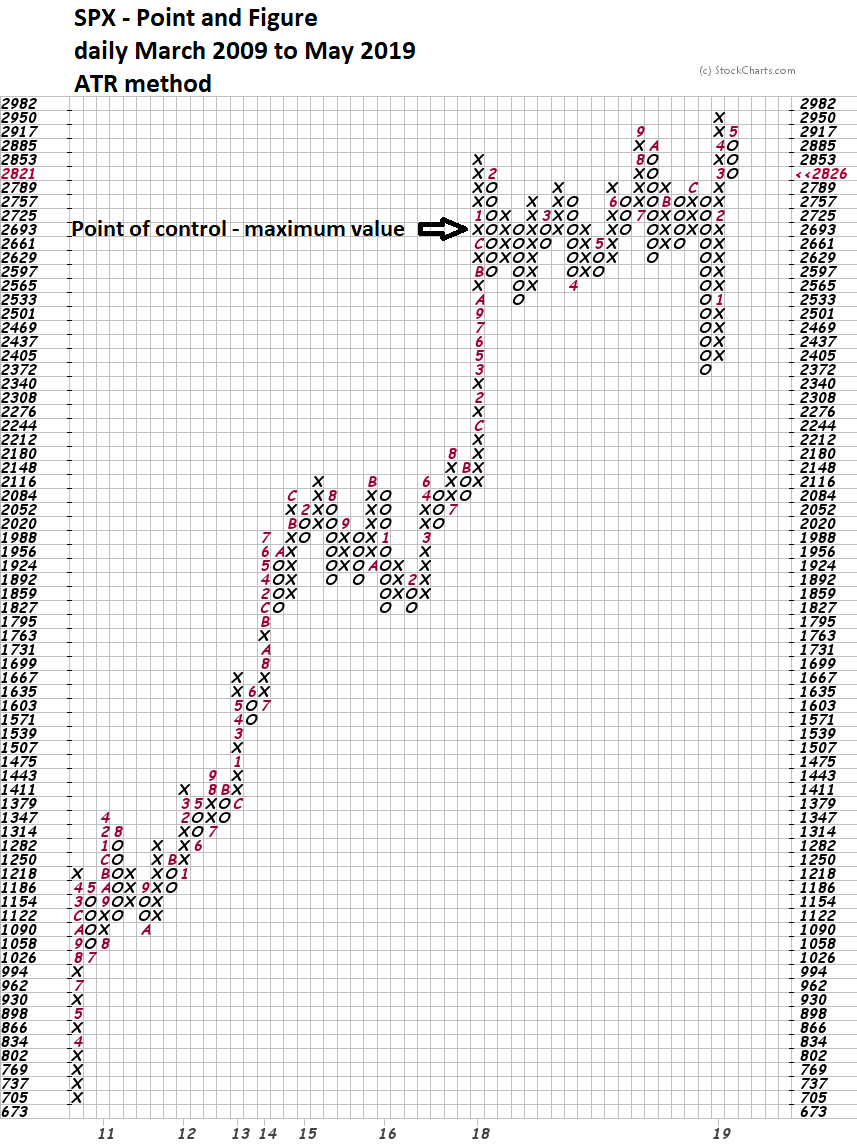
|
| Figure 1. Market Profile methodology defines value as the area with the greatest price overlap. |
| Graphic provided by: StockCharts.com. |
| |
| Time Factor Markets can occasionally move in segments measured by the Fibonacci sequence, which is: 1, 1, 2, 3, 5, 8, 13, 21, 34, 55, 89, 144, 233, to infinity. Please see the daily SPX chart illustrated in Figure 2. The distance between the October 3 top and the May 1 peak was a Fibonacci 144 trading days. The next closest Fibonacci time segment is May 31 which is 21 trading days after the May 1 peak. If the SPX is in the 2693 to 2725 area on May 31 a very important bottom could be forming. The 200-day Simple Moving Average (SMA) is currently at 2776 — a move down to the support zone would appear to be a decisive break. Note that in the late 2018 decline after three breaks of the 200-day SMA the SPX managed to rally back above the line. Perhaps a near-term break of the 200-day SMA could be a fake out that fools the majority. |
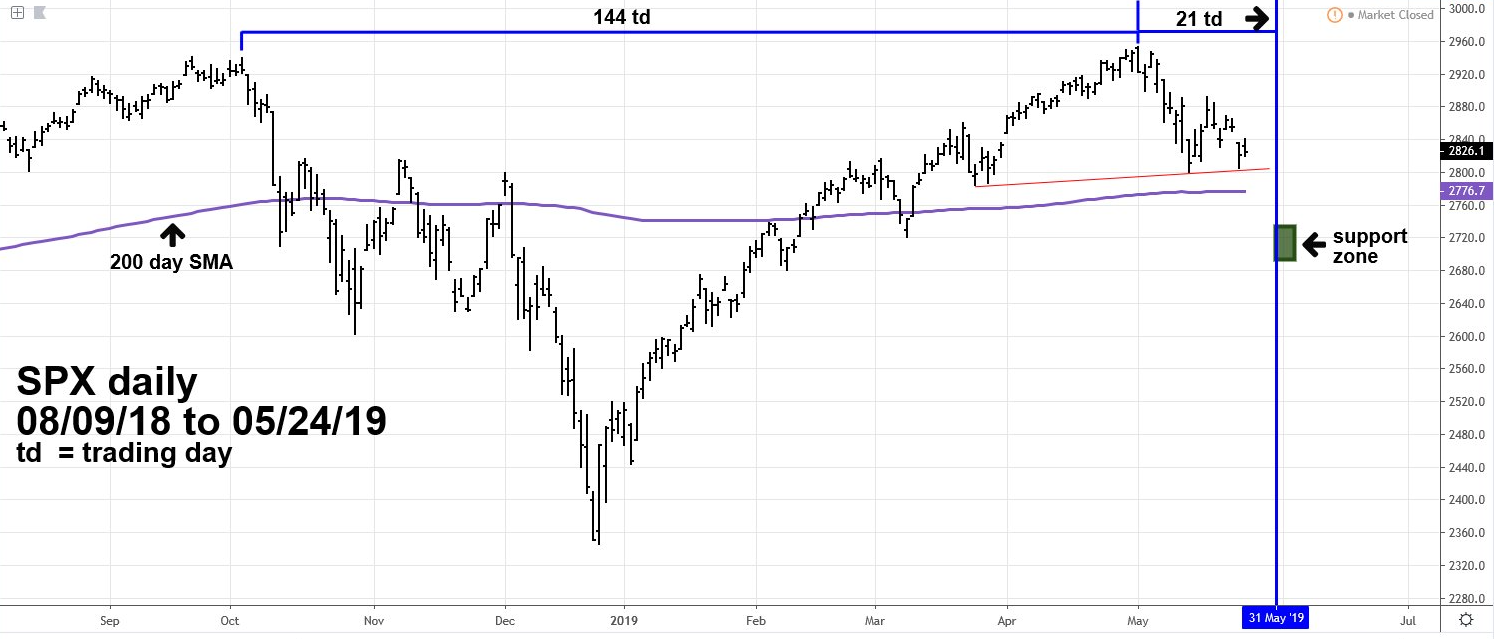
|
| Figure 2. If the SPX is in the 2693 to 2725 area on May 31, a very important bottom could be forming. |
| Graphic provided by: tradingview.com. |
| |
| Strategy Market charts are like battlefield maps where bulls and bears fight over important support/resistance points. The SPX low 2700 area could the most import point for the balance of the year. If the bears can break through 2693 there's very little in the way of chart support that could halt the decline until the next value area — the late December bottom area of 2350 to 2400. The rapid smooth move up from January to March could be retraced in an even faster move down. Could a decline down to 2400 happen by May 31? Possible, but doubtful — it would represent about a 20% drop in just 21 trading days. Declines of 20% or more usually take more time; the September to December SPX 20% decline took 58 trading days. If the SPX can continue to fall, 2693 to 2725 could be a bottom prior to a rally into new highs or a temporary pause in a larger bear market. Until there's more evidence, traders with time frames from a few weeks or longer, either bullish or bearish, should hold off on any new positions. However, SPX 2693 to 2725 represents powerful support and logically would require a powerful move to break through. If the SPX breaks below 2693 it could be a signal to go short. Caution, in this situation you may have to be nimble as a decline of several hundred points could be made in a few trading days, or just one day. Further Reading: Dalton James. F, Jones Eric. T & Dalton Robert. B (1993) "Mind Over Markets" Traders Press Inc. Dalton James. F, Jones Eric. T & Dalton Robert. B (2007) "Markets in Profile" John Wiley & Sons, Inc. |
Independent investment advisor, trader and writer. He has written articles for Technical Analysis of Stocks & Commodities, Traders.com Advantage,Futuresmag.com and, Finance Magnates. Author of website Four Dimension Trading.
| Website: | www.fourdimensiontrading.com |
| E-mail address: | markrivest@gmail.com |
Click here for more information about our publications!
Comments

Request Information From Our Sponsors
- VectorVest, Inc.
- Executive Premier Workshop
- One-Day Options Course
- OptionsPro
- Retirement Income Workshop
- Sure-Fire Trading Systems (VectorVest, Inc.)
- Trading as a Business Workshop
- VectorVest 7 EOD
- VectorVest 7 RealTime/IntraDay
- VectorVest AutoTester
- VectorVest Educational Services
- VectorVest OnLine
- VectorVest Options Analyzer
- VectorVest ProGraphics v6.0
- VectorVest ProTrader 7
- VectorVest RealTime Derby Tool
- VectorVest Simulator
- VectorVest Variator
- VectorVest Watchdog
- StockCharts.com, Inc.
- Candle Patterns
- Candlestick Charting Explained
- Intermarket Technical Analysis
- John Murphy on Chart Analysis
- John Murphy's Chart Pattern Recognition
- John Murphy's Market Message
- MurphyExplainsMarketAnalysis-Intermarket Analysis
- MurphyExplainsMarketAnalysis-Visual Analysis
- StockCharts.com
- Technical Analysis of the Financial Markets
- The Visual Investor