

HOT TOPICS LIST
- MACD
- Fibonacci
- RSI
- Gann
- ADXR
- Stochastics
- Volume
- Triangles
- Futures
- Cycles
- Volatility
- ZIGZAG
- MESA
- Retracement
- Aroon
INDICATORS LIST
LIST OF TOPICS
PRINT THIS ARTICLE
by Mark Rivest
How to use Fibonacci analysis to find high probability bottoms.
Position: N/A
Mark Rivest
Independent investment advisor, trader and writer. He has written articles for Technical Analysis of Stocks & Commodities, Traders.com Advantage,Futuresmag.com and, Finance Magnates. Author of website Four Dimension Trading.
PRINT THIS ARTICLE
FIBONACCI
Discovering Support Levels
05/16/19 04:47:27 PMby Mark Rivest
How to use Fibonacci analysis to find high probability bottoms.
Position: N/A
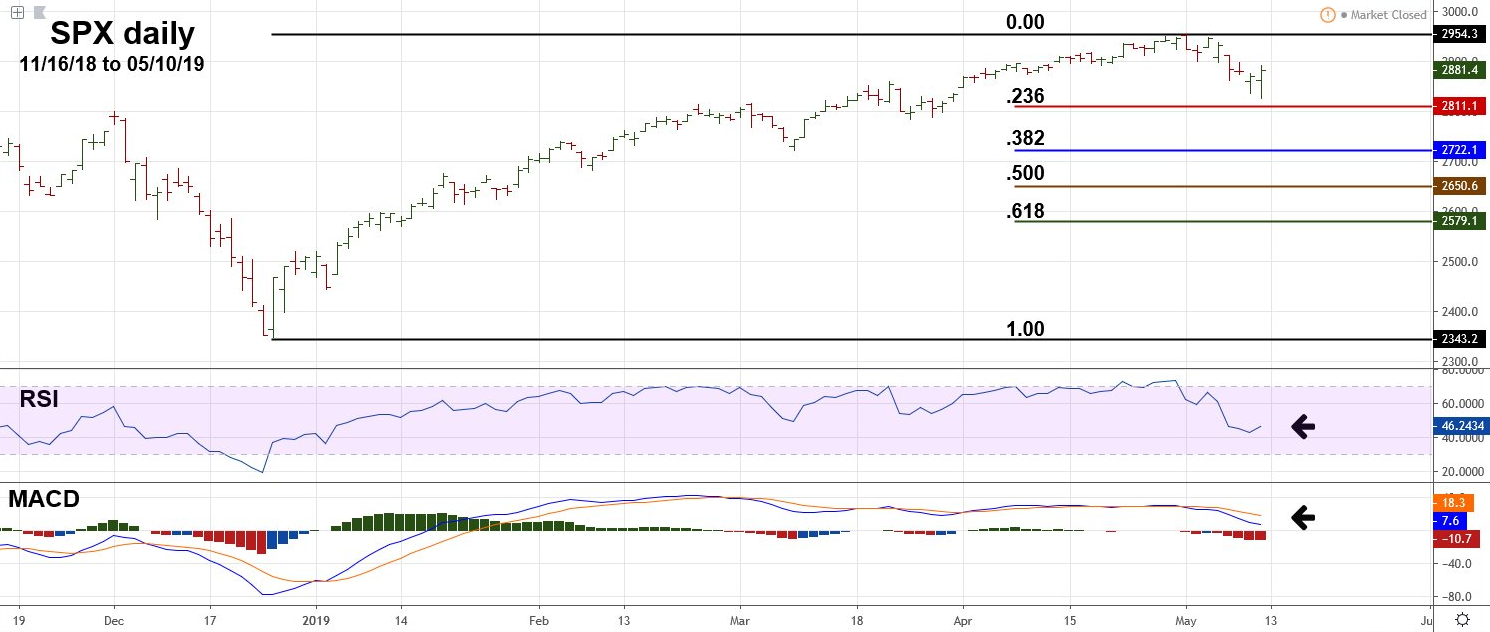
| At the start of May 2019, the S&P 500 (SPX) appeared to be heading towards major round number resistance at 3000, or perhaps hit major Fibonacci resistance at 3047. My May 9 article "On an All Time High" noted the SPX as of May 3 could be on the verge of blasting beyond 3047, yet there's been a decline. Is a major top in place for US stocks or is this just a correction in an ongoing bull market? Examining the weight of evidence provides clues as to where the US stock market could be going. Main Fibonacci Support Levels Fibonacci analysis is tied in closely with the Elliott Wave Theory. If you don't know anything about the Elliott method that's all right. Using Fibonacci techniques requires only knowing how to segment a market/stock into one or two parts. Before we examine the methodology, first let's examine what happened on May 1, 2019 — it implies the US stock market has begun at least an intermediate degree decline. The SPX failed to reach 3000, however it did reach a significant Fibonacci level of equality with the September 2018 high of 2940.90. The top on May 1 was 2954.10/2940.90 = a ratio of 1.004, very close to 1/1. US stocks are seasonally bullish until early May. In this case very early May. The decline since May 1 is now the longest and deepest since the rally began on December 26, 2018 — something different is happening. Please see the SPX daily chart November to May illustrated in Figure 1. The first step in discovering Fibonacci support levels is to measure the largest market segment, which in this case is the rally from December 26 to May 1. Next, find the various Fibonacci retracement levels. Currently the two to focus on are at .236 - SPX 2810.70 and .382 - SPX 2722.10. Also note the daily RSI and MACD. While they are in the deepest decline since the rally began in late December, they have not yet reached oversold levels. Implying more downside action. |
|
| Figure 1. The decline since May 1 is now the longest and deepest since the rally began on December 26, 2018 — something different is happening. |
| Graphic provided by: tradingview.com. |
| |
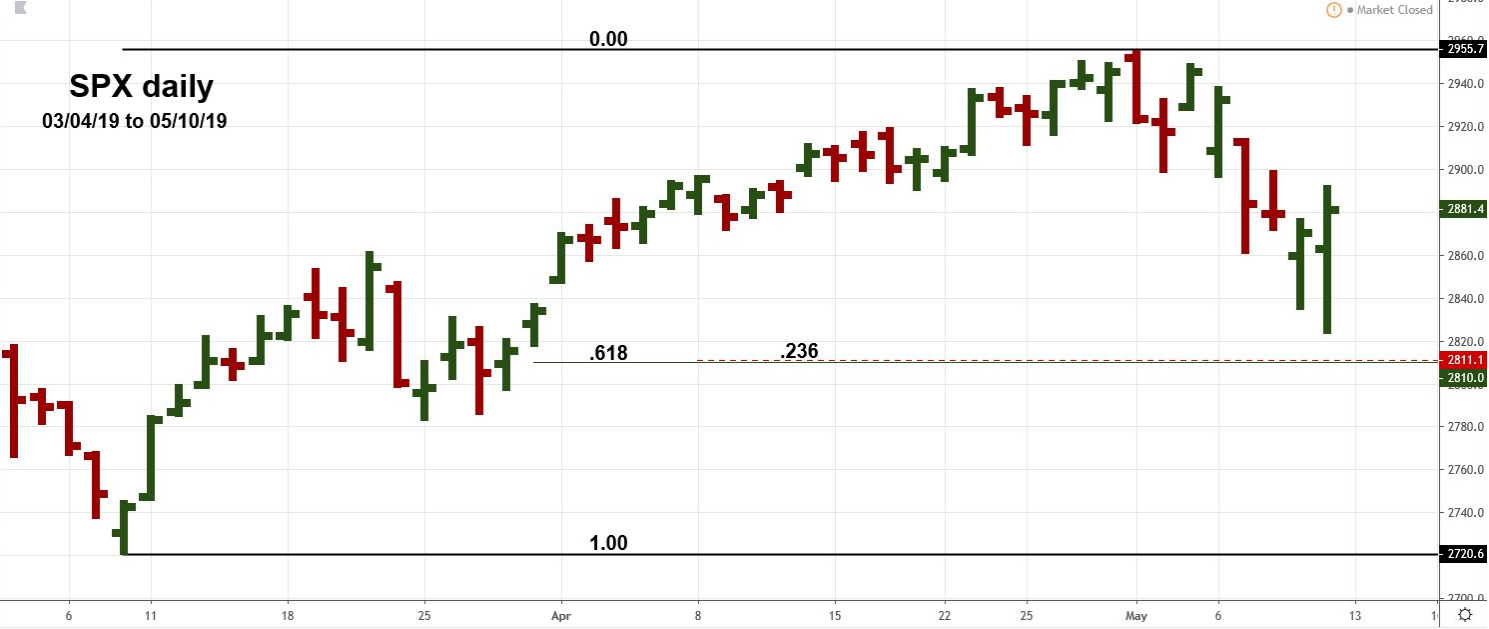
| Secondary Fibonacci Support Levels The next step to discovering a potential bottom is to break a market/stock into a smaller segment. To do this look for the largest correction of the primary uptrend, which in this case is the March 4 to March 8 decline. Please see the daily SPX chart March to May illustrated in Figure 2. There's one very important aspect regarding the SPX March 8 bottom at 2722.30. The distance between the March 8 low and the start of the rally at 2346.60 is 375.70 points multiplied by the Fibonacci golden ratio of .618 yields 232.20 points added to 2722.30 targets SPX 2954.50. The top on May 1 was 2954.10 — a bullseye hit! This secondary coordinate combined with the primary coordinate of 1/1 September to May tops implies the May peak could hold for at least several weeks. Within the March to May segment a .618 retrace is at SPX 2810.90; the larger segment's .236 retracement is at 2810.70 — almost an exact match! Chart support is always a Fibonacci coordinate; in this case 2722.30 represents a 1/1 or 100% retrace of the March to May rally. The larger segment's .382 retrace is at 2722.10, again almost an exact match! Fibonacci coordinates are like magnets, the more you have and the closer they are to each other increases the chances they could be hit. |
|
| Figure 2. Within the March to May segment a .618 retrace is at SPX 2810.90, while the larger segment's .236 retracement is at 2810.70 — almost an exact match! |
| Graphic provided by: tradingview.com. |
| |
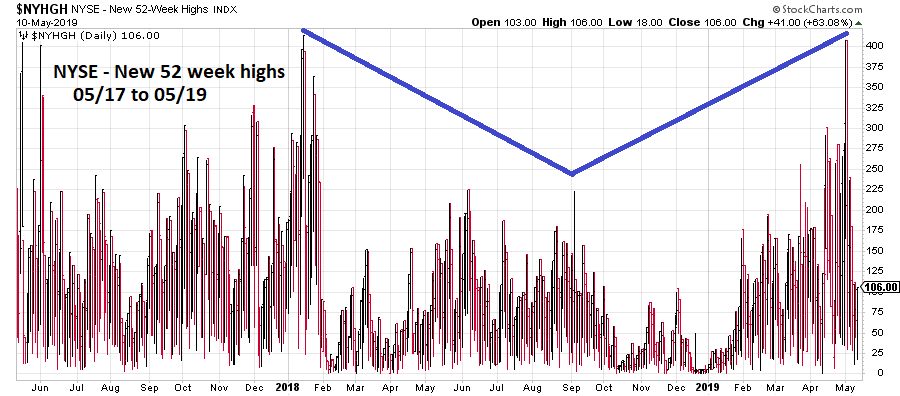
| Bullish Momentum Evidence The early May peak did have two distinctive pieces of bullish momentum evidence. The first is the chart of NYSE - New 52-week highs illustrated in Figure 3. Note the surge back up almost to the level when the SPX topped in January 2018. The SPX September 2018 peak had a significant bearish divergence. The second piece of bullish evidence comes from the Russell 2000 index (RUT). In my September 13, 2018 article "US Small Cap Stocks Lead the Way" noted that smaller cap stocks which make up the RUT are usually the first to top in a bull market. In 2018, RUT peaked on August 31 while the SPX top was made on September 21 and the Dow Jones Industrial Average (DJIA) high was on October 3. The DJIA post-December 2018 rally high was made on April 23. The Nasdaq Composite rally ended on April 29 and the SPX post-December high was May 1. RUT reached its rally high on May 6. If a major bear market began in early May 2019 why would the stocks of the smallest and weakest companies be the last ones to complete a bull market? |
|
| Figure 3. Note the surge back up almost to the level when the SPX topped in January 2018. The SPX September 2018 peak had a significant bearish divergence. |
| Graphic provided by: StockCharts.com. |
| |
| Strategy Major stock market turns typically come with overwhelming evidence, that case can't be made at the May 2019 top. There is, however, enough evidence to suggest an intermediate degree decline lasting at least several weeks has begun. Hold off on any new long positions until at least the daily RSI and MACD have reached oversold levels. Depending on portfolio size and type, partial liquidations and or hedging would be appropriate. It's possible both SPX targets of 2810 and 2722 could be hit, with a rally off the higher target followed by a decline to the lower target at 2722. There are short term Fibonacci coordinates just below 2722. It's possible a false break of this support could occur, fooling the majority. This scenario will be examined in greater detail if needed. Until then be prepared for more downside activity and watch for bottoming signals at support levels. |
Independent investment advisor, trader and writer. He has written articles for Technical Analysis of Stocks & Commodities, Traders.com Advantage,Futuresmag.com and, Finance Magnates. Author of website Four Dimension Trading.
| Website: | www.fourdimensiontrading.com |
| E-mail address: | markrivest@gmail.com |
Click here for more information about our publications!
Comments

Request Information From Our Sponsors
- VectorVest, Inc.
- Executive Premier Workshop
- One-Day Options Course
- OptionsPro
- Retirement Income Workshop
- Sure-Fire Trading Systems (VectorVest, Inc.)
- Trading as a Business Workshop
- VectorVest 7 EOD
- VectorVest 7 RealTime/IntraDay
- VectorVest AutoTester
- VectorVest Educational Services
- VectorVest OnLine
- VectorVest Options Analyzer
- VectorVest ProGraphics v6.0
- VectorVest ProTrader 7
- VectorVest RealTime Derby Tool
- VectorVest Simulator
- VectorVest Variator
- VectorVest Watchdog
- StockCharts.com, Inc.
- Candle Patterns
- Candlestick Charting Explained
- Intermarket Technical Analysis
- John Murphy on Chart Analysis
- John Murphy's Chart Pattern Recognition
- John Murphy's Market Message
- MurphyExplainsMarketAnalysis-Intermarket Analysis
- MurphyExplainsMarketAnalysis-Visual Analysis
- StockCharts.com
- Technical Analysis of the Financial Markets
- The Visual Investor