

HOT TOPICS LIST
- MACD
- Fibonacci
- RSI
- Gann
- ADXR
- Stochastics
- Volume
- Triangles
- Futures
- Cycles
- Volatility
- ZIGZAG
- MESA
- Retracement
- Aroon
INDICATORS LIST
LIST OF TOPICS
PRINT THIS ARTICLE
by Mark Rivest
The Russell 2000 small cap stock index has been leading the way up. See why it may soon lead the way down.
Position: N/A
Mark Rivest
Independent investment advisor, trader and writer. He has written articles for Technical Analysis of Stocks & Commodities, Traders.com Advantage,Futuresmag.com and, Finance Magnates. Author of website Four Dimension Trading.
PRINT THIS ARTICLE
ELLIOTT WAVE
US Small Cap Stocks Lead the Way
09/13/18 05:09:13 PMby Mark Rivest
The Russell 2000 small cap stock index has been leading the way up. See why it may soon lead the way down.
Position: N/A
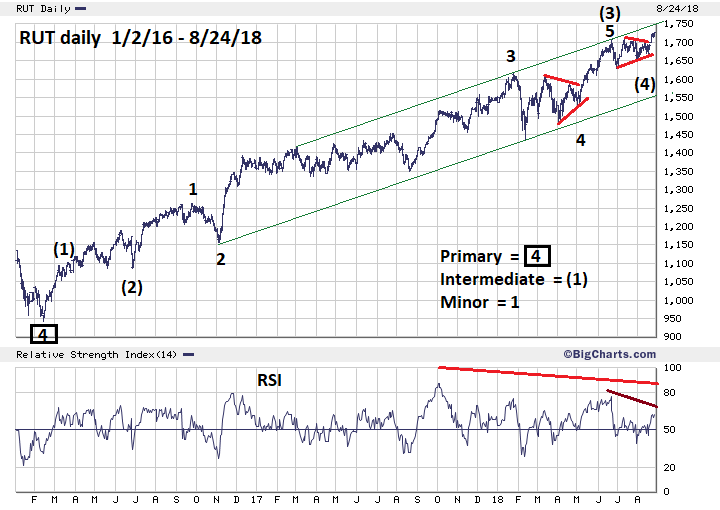
| Stock markets anticipate economic change and will usually top/bottom six to nine months before economic fundamentals change. In bull markets the largest and most profitable companies' stocks typically peak last, as they can resist best during the early phase of a recession. Conversely, smaller companies' stocks are usually the first to top in a bull market. This happened in the year 2000 when the Russell 2000 (RUT) peaked two weeks before the S&P 500 (SPX). In 2007 the RUT climaxed three months prior to the SPX top. The same phenomenon could be happening in 2018. RUT Daily 2016-2018 On June 20, 2018, RUT reached 1708.09 and appeared to have hit major resistance, noted in my June 28 article "Have US Small Cap Stocks Topped?" Subsequently, RUT had a small decline, then on July 10 made a very marginal new high. RUT then had another shallow correction prior to making a new all-time high. My June 28 article stated that the course taken by RUT from January to May was a text book example of an Elliott wave Horizontal Triangle. A very fascinating factor is that the sideways movement of RUT from June to August appears to be another Horizontal Triangle. This is a very important clue because Horizontal Triangles only appear in the fourth wave position of motive waves and in the "B" wave position of an (A, B, C) corrective pattern. Please see the daily RUT chart illustrated in Figure 1. It appears that in 2018 RUT has formed a series of "fours" and "fives" which correlate to the series of "ones" and "twos" of the motive wave that began in February of 2016. My June 28 article noted that after completion of a Horizontal Triangle there's usually a sharp thrust in the direction of the primary trend. Typically, the widest part of the Horizontal Triangle, when added to the triangles termination point, can forecast the completion point of the post triangle thrust. The widest part of the January to May triangle was 179.09, added to the triangles end made on May 1 at 1527.71 targets 1706.80. The June 20 top was 1708.09. The widest part of the June to August triangle was 78.48, added to the triangles end on August 16 at 1663.53 targets RUT 1742.01, which is very close to the rising trend line from March of 2017. |
|
| Figure 1. A very fascinating factor is that the sideways movement of RUT from June to August appears to be another Horizontal Triangle. |
| Graphic provided by: BigCharts.com. |
| |
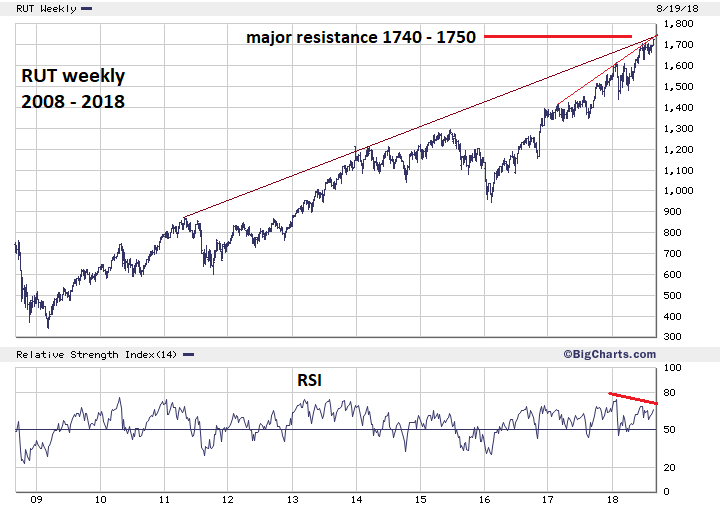
| RUT Weekly 2008-2018. Usually when drawing trend lines for a stock or index after there's been a large percentage increase, it's more effective to use a logarithmic scale chart. In a few occasions, arithmetic scale works. In the case of the RUT bull market that began in 2009, the message from the weekly arithmetic scale chart is amazing. Please see the weekly RUT chart illustrated in Figure 2. The trend line going all the way back to the top made in 2011 crosses very close to the intermediate trend line from 2017 around RUT 1740 to 1750. The intersection point of the two trend lines is during the week of August 27 to 31. If the RUT does make a peak in this zone the long-term trend line implies a top that could hold for several years. Also note the weekly RSI has a significant double bearish divergence as does the daily RSI. There is no monthly RSI bearish divergence for the bull cycle that began in 2009. Although there is a monthly bearish RSI divergence against the RUT peak made in May of 1996. |
|
| Figure 2. The trend line going all the way back to the top made in 2011 crosses very close to the intermediate trend line from 2017, around RUT 1740 to 1750. |
| Graphic provided by: BigCharts.com. |
| |
| Review Of The Main US Stock Indices S&P 500: On August 24 the SPX made a new all-time high. From an Elliott wave perspective this confirms a possible fifth wave exceeding what appears to be a third wave made in January 2018. This alone means we should be on alert that the SPX could have made an important top on August 24th. Also, the SPX was only a little more than three points above the January top. The Fibonacci ratio of equality, 1/1 is very common. In this case the supposed fifth wave is near equal to the supposed fourth wave. Potential Fibonacci resistance is another reason to be wary the SPX could be at or near a significant top. Finally, there's the potential long-term time relationship mentioned in my July 26 article, "Stock Market Time Tunnel". The bulls eye date for a significant SPX top was August 20, 2018. If the RUT does top in the resistance zone of 1740-1750 or has already peaked, probabilities favor the SPX rally continuing for at least two weeks. But we must be open to all possibilities. While not likely, the SPX could have a significant top the same time or even before the RUT has peaked. Nasdaq Composite: This index also made a new all-time high on August 24. Short term this is bullish. The final peaks in 2000 and in 2007 tops were made with only one of the three main US stock indices. If a significant top is made in 2018, the final top could be made by one index unconfirmed by the other two indices. Dow Jones Industrial Average: My January 15 article, "RSI - The Super Indicator", noted that in January this index made an all-time high confirmed by the monthly, weekly, and daily RSI. Significant stock and stock index tops almost always have at least one bearish RSI divergence. This implies the Industrials could make at least a marginal new high sometime in early or mid-September. The cumulative evidence from RUT and the main US stock indices imply a major RUT top sometime during the week of August 27-31. The SPX could reach near the 3000 level with the Dow Jones Industrial Average making a marginal new high sometime in early to mid-September 2018. Further Reading: Frost A.J and Robert Prechter (1985) "Elliott Wave Principle", New Classics Library. |
Independent investment advisor, trader and writer. He has written articles for Technical Analysis of Stocks & Commodities, Traders.com Advantage,Futuresmag.com and, Finance Magnates. Author of website Four Dimension Trading.
| Website: | www.fourdimensiontrading.com |
| E-mail address: | markrivest@gmail.com |
Click here for more information about our publications!
Comments

Request Information From Our Sponsors
- StockCharts.com, Inc.
- Candle Patterns
- Candlestick Charting Explained
- Intermarket Technical Analysis
- John Murphy on Chart Analysis
- John Murphy's Chart Pattern Recognition
- John Murphy's Market Message
- MurphyExplainsMarketAnalysis-Intermarket Analysis
- MurphyExplainsMarketAnalysis-Visual Analysis
- StockCharts.com
- Technical Analysis of the Financial Markets
- The Visual Investor
- VectorVest, Inc.
- Executive Premier Workshop
- One-Day Options Course
- OptionsPro
- Retirement Income Workshop
- Sure-Fire Trading Systems (VectorVest, Inc.)
- Trading as a Business Workshop
- VectorVest 7 EOD
- VectorVest 7 RealTime/IntraDay
- VectorVest AutoTester
- VectorVest Educational Services
- VectorVest OnLine
- VectorVest Options Analyzer
- VectorVest ProGraphics v6.0
- VectorVest ProTrader 7
- VectorVest RealTime Derby Tool
- VectorVest Simulator
- VectorVest Variator
- VectorVest Watchdog