

HOT TOPICS LIST
- MACD
- Fibonacci
- RSI
- Gann
- ADXR
- Stochastics
- Volume
- Triangles
- Futures
- Cycles
- Volatility
- ZIGZAG
- MESA
- Retracement
- Aroon
INDICATORS LIST
LIST OF TOPICS
PRINT THIS ARTICLE
by Mark Rivest
Could August 20, 2018 be the day of a major stock market top?
Position: N/A
Mark Rivest
Independent investment advisor, trader and writer. He has written articles for Technical Analysis of Stocks & Commodities, Traders.com Advantage,Futuresmag.com and, Finance Magnates. Author of website Four Dimension Trading.
PRINT THIS ARTICLE
MARKET TIMING
Stock Market Time Tunnel
07/26/18 04:08:44 PMby Mark Rivest
Could August 20, 2018 be the day of a major stock market top?
Position: N/A
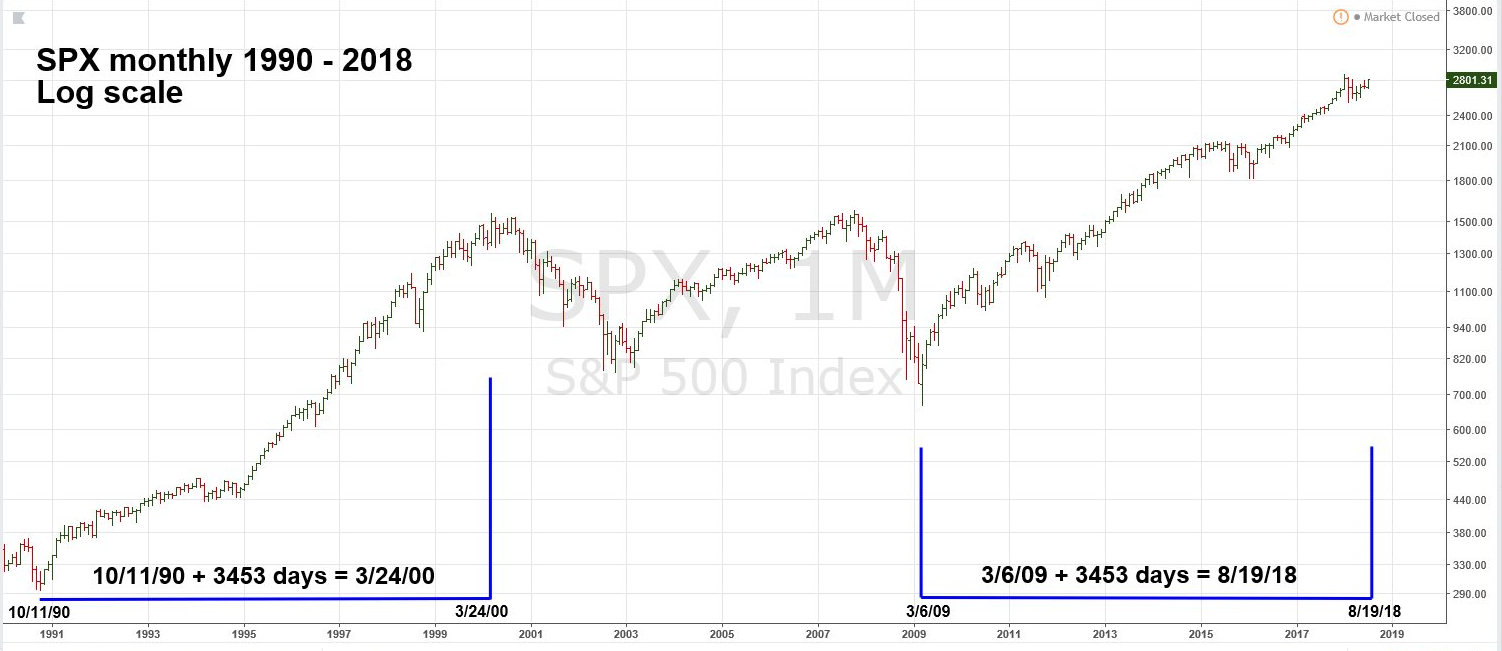
| The S&P 500 (SPX) bull market from October 1990 to March 2000 is very similar to the SPX bull market that began in March 2009. A combination of seasonal factors and Fibonacci time cycles indicate August 2018 could be the time for a major stock market top. Knowledge of the relationship between today's stock market and the 1990's could be the key to successful trading in 2018 and beyond. Analogy Of Two Markets R.N Elliott discovered the wave principle, now known as the Elliott Wave Theory. He also discovered Fibonacci time and price market relationships. For the dimension of time he noted that markets can be measured using the Fibonacci sequence, which is: (1, 1, 2, 3, 5, 8, 13, 21, 34, 55, 89, 144, to infinity). For example, the Dow Jones Industrial Average bull market from 1932 to 1937 was five years. Robert Prechter expanded on this concept and illustrated many instances of Fibonacci ratio relationships in his book "Beautiful Pictures". Perhaps the most common Fibonacci ratio is equality, 1/1. This is where one market segment will equal another market segment in time and or price. The SPX monthly chart illustrated in Figure 1 examines the relationship between the 1990's SPX bull market with the current bull market that began in March 2009. The bull market from October 11, 1990 lasted nine years five months and fourteen days or 3453 days. The current bull market that began March 6, 2009 will be nine years and five months old in August of 2018. The exact date of equality is Sunday August 19, 2018, so the closest trading day is August 20. Also note that the form of both markets is very similar. The SPX bull market that began in 1990 had only one correction that was greater than twenty percent, this was the 22.4% decline recorded in 1998. The largest correction of the bull market from 2009 occurred in 2011 with a 21.5% decline. |
|
| Figure 1. The exact date of equality is Sunday, August 19, 2018, so the closest trading day is August 20. |
| Graphic provided by: Tradingview.com. |
| |
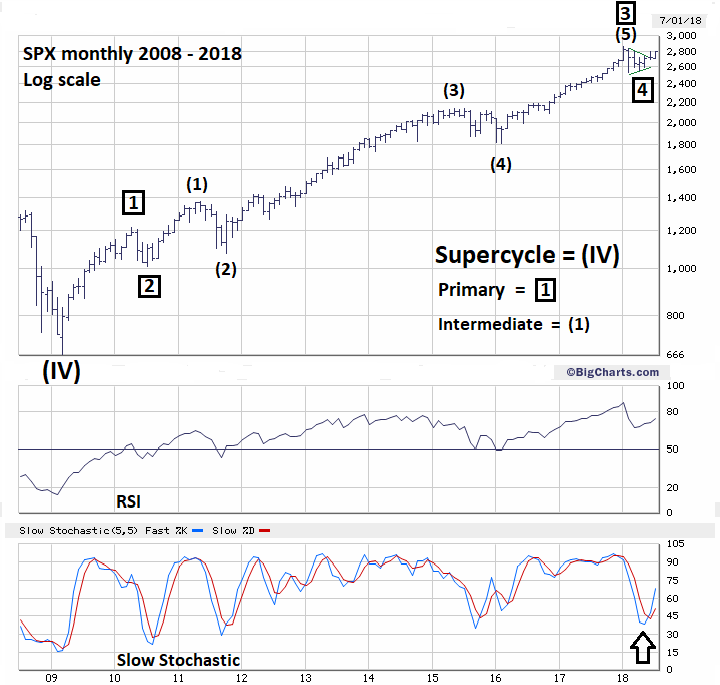
| Long Term Elliott Wave Count The pattern of the SPX from its all-time high made in January 2018 has opened the door for a new prime wave count. Previously I believed that if the SPX were to exceed its January 2018 top it could be completing a third wave up from the bottom made in March 2009. In my May 24 article "Global Bullish Confirmation" I noted that an Elliott wave Horizontal Triangle could have completed on May 3 at the SPX bottom of 2594.62. If this pattern is correct its sizes in price and time are larger than the other corrections since the SPX February 2016 bottom. It's more likely that the correction from January is a higher degree, more in line with the multi-month corrections since the March 2009 bottom. There's Fibonacci ratio evidence to back up this theory. Please see the SPX monthly chart 2008-2018 illustrated in Figure 2. An Elliott motive wave will usually have a relationship between waves "one" and "five". The SPX rally from 2010 to 2011 labeled as Intermediate wave (1) had a growth rate of 35.57%. The rally from 2016 to 2018 labeled as Intermediate wave (5) had a growth rate of 58.71%. The ratio of 35.57/58.71 is .605 very close to the Fibonacci Golden Ratio of .618. The growth rate of the rally from 2009 to 2010 labeled as Primary wave 1-boxed was 82.93%. The supposed Primary wave 4-boxed is a Horizontal Triangle. Normally when measuring a post triangle move the calculation would be made from the end of the triangle not the extreme point. In this case the end was at SPX 2594.62, while the extreme was at 2532.69. However, if you multiply 82.93% by the Fibonacci ratio of .236 it equals a growth rate of 19.57%. Adding a growth of 19.57% to 2532.69 targets 3028.33, very close to major Fibonacci resistance at 3047, noted in my February 1 article "How High is Up". |
|
| Figure 2. The pattern of the SPX from its all-time high made in January 2018 has opened the door for a new prime wave count. |
| Graphic provided by: BigCharts.com. |
| |
| Season and Summary There's precedence for August having important seasonal stock market tops/bottoms. August 9, 1982: major bear market bottom. August 25, 1987: major top prior to a crash. August 13, 2004: end of multi-month correction and low of the year. August 9, 2011: mini crash low. August 24, 2015: mini crash low. August 15, 2016: intermediate top prior to a multi-month correction. The comparison of the two bull markets covers a period of spanning decades. While a direct hit with a top made on August 20 would be fantastic, it's not necessary. With several prior important turns in August, if the SPX were to make a new all-time high any time during the month, it has the potential to be a final peak. Of course, the time forecast could completely fail, there's no predestination in the markets. If the SPX at the end of August still has not breached its all-time high of 2872.87 it's a clue that another time cycle is in effect. The ideal scenario is the SPX reaches near 3047 in August. If this happens there's the potential for a turn that could last several months or years. Further Reading: Frost A.J and Robert Prechter (1985) "Elliott Wave Principle", New Classics Library. Prechter Jr. R. Robert (2003) "Beautiful Pictures", New Classics Library. |
Independent investment advisor, trader and writer. He has written articles for Technical Analysis of Stocks & Commodities, Traders.com Advantage,Futuresmag.com and, Finance Magnates. Author of website Four Dimension Trading.
| Website: | www.fourdimensiontrading.com |
| E-mail address: | markrivest@gmail.com |
Click here for more information about our publications!
PRINT THIS ARTICLE

Request Information From Our Sponsors
- StockCharts.com, Inc.
- Candle Patterns
- Candlestick Charting Explained
- Intermarket Technical Analysis
- John Murphy on Chart Analysis
- John Murphy's Chart Pattern Recognition
- John Murphy's Market Message
- MurphyExplainsMarketAnalysis-Intermarket Analysis
- MurphyExplainsMarketAnalysis-Visual Analysis
- StockCharts.com
- Technical Analysis of the Financial Markets
- The Visual Investor
- VectorVest, Inc.
- Executive Premier Workshop
- One-Day Options Course
- OptionsPro
- Retirement Income Workshop
- Sure-Fire Trading Systems (VectorVest, Inc.)
- Trading as a Business Workshop
- VectorVest 7 EOD
- VectorVest 7 RealTime/IntraDay
- VectorVest AutoTester
- VectorVest Educational Services
- VectorVest OnLine
- VectorVest Options Analyzer
- VectorVest ProGraphics v6.0
- VectorVest ProTrader 7
- VectorVest RealTime Derby Tool
- VectorVest Simulator
- VectorVest Variator
- VectorVest Watchdog