HOT TOPICS LIST
- MACD
- Fibonacci
- RSI
- Gann
- ADXR
- Stochastics
- Volume
- Triangles
- Futures
- Cycles
- Volatility
- ZIGZAG
- MESA
- Retracement
- Aroon
INDICATORS LIST
LIST OF TOPICS
PRINT THIS ARTICLE
by Mark Rivest
Signals from three major stock indices imply strong rally underway.
Position: N/A
Mark Rivest
Independent investment advisor, trader and writer. He has written articles for Technical Analysis of Stocks & Commodities, Traders.com Advantage,Futuresmag.com and, Finance Magnates. Author of website Four Dimension Trading.
PRINT THIS ARTICLE
ELLIOTT WAVE
Global Bullish Confirmation
05/24/18 03:42:10 PMby Mark Rivest
Signals from three major stock indices imply strong rally underway.
Position: N/A
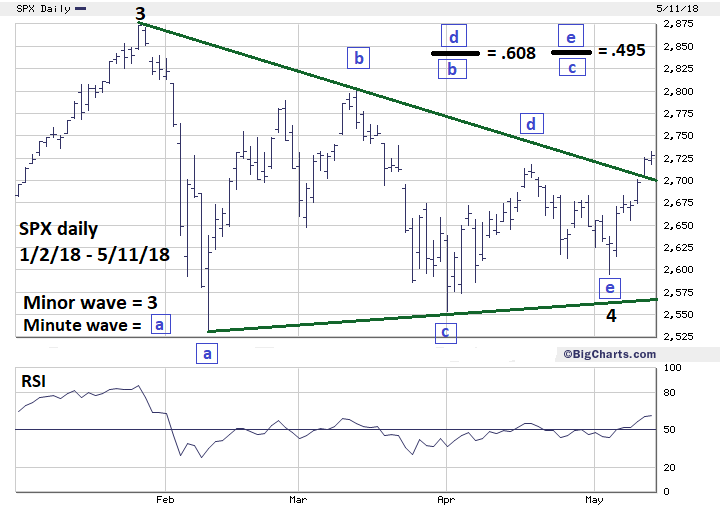
| The S&P 500 (SPX), FTSE 100 (UKX) and Hang Seng (HSI) could very soon reach new all-time highs. Elliott wave patterns and Fibonacci relationships provide evidence that the worldwide stock market correction that began in January is now complete. S&P 500 Daily In my February 15 article "S&P 500 - Deadly Ground" I noted the briefness of the decline — only ten trading days — and that Minor wave "4" could still be under construction. I also noted that "Elliott wave Horizontal Triangles are a typical wave (four) price pattern. Horizontal Triangles go sideways and are choppy." The SPX chart in Figure 1 shows that's what happened. The most common Fibonacci relationships within a Horizontal Triangle occur between adjacent waves, such as wave "d" is related to wave "b". Within the SPX Horizontal Triangle-Minute wave "d"-boxed is .608 of Minute wave "b"-boxed, very close to the Golden Fibonacci ratio of .618. Minute wave "e"-boxed is .495 of Minute wave "c"-boxed, very close to the Fibonacci ratio of .50. On May 10 the SPX broke above the declining upper trend line and above the peak of the supposed Minute wave "d" at 2717.49. The breach of these resistance points strongly implies the Horizontal Triangle is complete. Upon completion of a triangle, markets will usually have a powerful trust in the direction of the primary trend. The SPX could make a new all-time high by late May or early June 2018. Finally, my February 1 article "How High is Up" noted major SPX-Fibonacci resistance at 3047. In an Elliott standard five wave pattern wave "One" is usually equal in price growth to wave "Five". The progress from the SPX February 10, 2016 bottom at 1810 to the peak made June 8, 2016 is probably Minor wave "1", a growth rate of 17.1%. After completion of a Horizontal Triangle wave "Four" the calculation for wave "Five" is made at the end of the triangle, not the low point. In this case the SPX triangle ended at 2594.62 on May 3, 2018. Adding 17.1% growth to 2594.62 targets SPX 3038 which is very close to major Fibonacci resistance at 3047. |

|
| Figure 1. Upon completion of a triangle, markets will usually have a powerful thrust in the direction of the primary trend. |
| Graphic provided by: BigCharts.com. |
| |
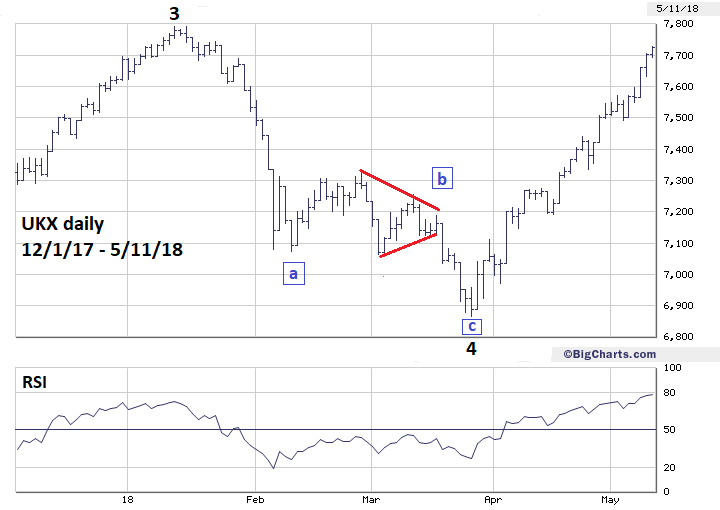
| FTSE 100 Daily Please see the UKX daily chart illustrated in Figure 2. The UKX correction from its January all-time high did not form an Elliott wave Horizontal Triangle. The best count appears to be a Single Zigzag, with a small Horizontal Triangle forming Minute wave "b"-boxed. Note, Horizontal Triangles appear in wave "Four" of impulse waves and in wave "b" of corrective waves. The UKX decline was 11.8%, the same as the SPX 11.8% drop, although it took the UKX 52 trading days vs. the SPX 10 trading days. Since its March 26 bottom the UKX has been in a powerful rally which could be a preview of what the SPX could do in the coming weeks. The strength of the UKX rally implies the global economy is currently not ripe for a contraction. As of May 11, the UKX had retraced 93% of its January to March decline. Usually when an index has this deep of a retracement it implies the prior peak will probably be eclipsed. The UKX could be the vanguard for the other major world stock indices. On the bearish side of the coin, if the UKX makes a new all-time high by itself and is not confirmed by other stock indices it could be a major sell signal. |

|
| Figure 2. Since its March 26 bottom the UKX has been in a powerful rally which could be a preview of what the SPX could do in the coming weeks. |
| Graphic provided by: BigCharts.com. |
| |
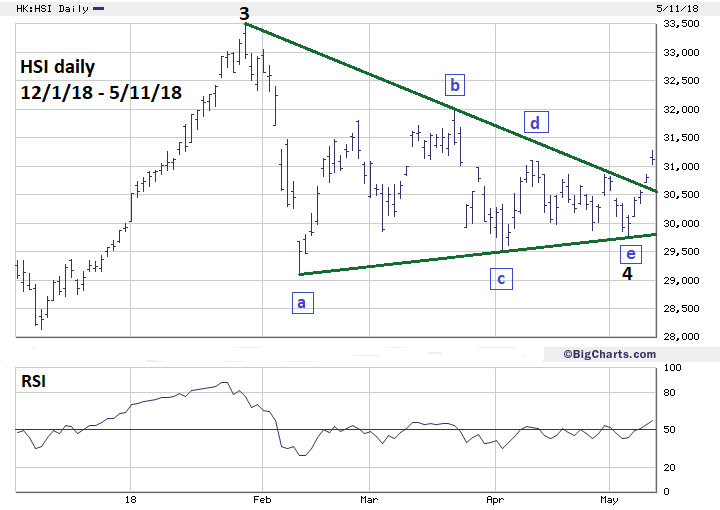
| Hang Seng Daily My May 3 article "Signals From the Hang Seng" noted that "sometimes the price patterns of one national stock index could confirm the pattern of another national stock index." The HSI daily chart illustrated in Figure 3 shows it continues to confirm the SPX Elliott wave pattern. On May 11 the HSI was above both the upper declining trend line and its supposed Minute wave "d" top. This strongly suggest the HSI is also in a powerful rally and could soon be making a new all-time high. |

|
| Figure 3. The HSI continues to confirm the SPX Elliott wave pattern. |
| Graphic provided by: BigCharts.com. |
| |
| Conclusion One of the guidelines in using Elliott theory is called alternation — expect something different. December to January the SPX was in a powerful move up. This was followed by a violent move down, then several weeks of choppy sideways trading. Perhaps the SPX will now return to a powerful move up? My February 1 article speculated that a major top could occur in May 2018. As of this writing the SPX has thirteen trading days remaining in May. While it's possible the SPX could reach 3047 before the end of May, the rally could continue into June. One very interesting day for a possible major top is June 12. This is the date for the expected summit meeting between US president Trump and North Korean leader Kim Jong-un. This "feel good moment" could be a stopping point for the stock bull market. Further Reading: Frost A.J and Robert Prechter (1985) "Elliott Wave Principle", New Classics. |
Independent investment advisor, trader and writer. He has written articles for Technical Analysis of Stocks & Commodities, Traders.com Advantage,Futuresmag.com and, Finance Magnates. Author of website Four Dimension Trading.
| Website: | www.fourdimensiontrading.com |
| E-mail address: | markrivest@gmail.com |
Click here for more information about our publications!
Comments

Request Information From Our Sponsors
- VectorVest, Inc.
- Executive Premier Workshop
- One-Day Options Course
- OptionsPro
- Retirement Income Workshop
- Sure-Fire Trading Systems (VectorVest, Inc.)
- Trading as a Business Workshop
- VectorVest 7 EOD
- VectorVest 7 RealTime/IntraDay
- VectorVest AutoTester
- VectorVest Educational Services
- VectorVest OnLine
- VectorVest Options Analyzer
- VectorVest ProGraphics v6.0
- VectorVest ProTrader 7
- VectorVest RealTime Derby Tool
- VectorVest Simulator
- VectorVest Variator
- VectorVest Watchdog
- StockCharts.com, Inc.
- Candle Patterns
- Candlestick Charting Explained
- Intermarket Technical Analysis
- John Murphy on Chart Analysis
- John Murphy's Chart Pattern Recognition
- John Murphy's Market Message
- MurphyExplainsMarketAnalysis-Intermarket Analysis
- MurphyExplainsMarketAnalysis-Visual Analysis
- StockCharts.com
- Technical Analysis of the Financial Markets
- The Visual Investor
