

HOT TOPICS LIST
- MACD
- Fibonacci
- RSI
- Gann
- ADXR
- Stochastics
- Volume
- Triangles
- Futures
- Cycles
- Volatility
- ZIGZAG
- MESA
- Retracement
- Aroon
INDICATORS LIST
LIST OF TOPICS
PRINT THIS ARTICLE
by Mark Rivest
Fibonacci analysis reveals the most important point on the S&P 500 chart.
Position: N/A
Mark Rivest
Independent investment advisor, trader and writer. He has written articles for Technical Analysis of Stocks & Commodities, Traders.com Advantage,Futuresmag.com and, Finance Magnates. Author of website Four Dimension Trading.
PRINT THIS ARTICLE
ELLIOTT WAVE
S&P 500 - Deadly Ground
02/15/18 04:21:46 PMby Mark Rivest
Fibonacci analysis reveals the most important point on the S&P 500 chart.
Position: N/A
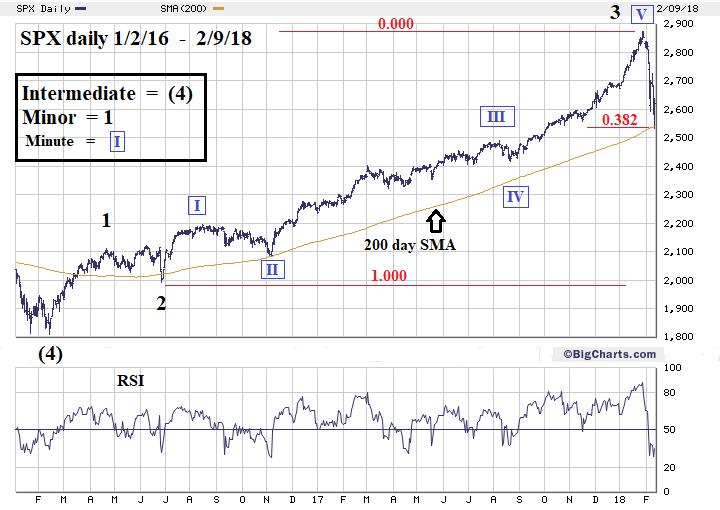
| The US stock market has within three weeks gone from a rapid advance to an even more rapid decline. The start of a new bear market? Perhaps, but sentiment and momentum indicators strongly suggest that for the short term, stock market bears are exhausted. Additionally, Fibonacci analysis pin points a key support level. S&P 500 - Daily The ancient Chinese military strategist Sun Tzu wrote in "The Art of War": "Where if one who does battle with full force survives, and one who does not do battle full force perishes, this is called the deadly ground". For ten trading days the stock bears broke through several support areas in a fast and vicious decline. At mid-day on February 9, 2018 the S&P 500 (SPX) hit 2532.69, then had the largest and fastest rally since the mini crash began, rising an incredible 103.98 points in just over two hours. SPX 2532.69 was deadly ground for the bears. Please see the SPX daily chart illustrated in Figure 1. Fibonacci analysis is a fantastic tool in determining very precise support/resistance areas. It can also be of great help in finding the correct Elliott wave count. Typically, fourth waves in any degree five wave impulse pattern will retrace either .236 or .382 of the prior third waves progress. The reason for the relatively shallow retrace is that the mass mind recognizes the main direction after the progress made from waves one through three. In the case of a stock bull market, most traders/investor will hold the bulk of their long positions. The SPX Minor wave "2" bottom made on June 27, 2016 at 1991.68 to the top of Minor wave "3" made on January 26, 2018 is 881.19 x .382 = 336.61. Subtracting 336.61 from the Minor wave "3" top at 2872.87 targets SPX 2536.56; the actual bottom was 2532.69. There's usually a Fibonacci relationship between waves "two" and "four". Minor wave "2" decline is 128.87. The supposed Minor wave "4" decline into 2532.69 was 340.18 points. 128.87/340.18 = .378 very close to the Fibonacci relationship of .382. There's also a Fibonacci relationship between Minor wave "1" and "3". Minor wave "1" was followed by a combination wave correction in which the mid portion "X" wave exceeded the orthodox peak of Minor wave "1" made on April 20, 2016. Measuring from the actual peak of 2120.55 made on June 8, 2016 to the February 10, 2016 bottom at 1810.10 is 310.45 points — a growth rate of 17.1% Minor wave "3" is 881.19 points, its growth rate from the Minor wave "2" bottom of 1991.68 is 44.2%. 17.1%/44.2% = .386 extremely close to the Fibonacci relationship of .382. The 200-day Simple Moving Average (SMA) could also be signaling support in the SPX 2530 area, this line on February 9 was at 2539.27. The 200-day SMA signaled support at the June 27, 2016 and November 3, 2016 bottoms. Finally, markets will sometimes turn at anniversary dates. February 9, 2018 is almost exactly two years from the major SPX bottom on February 10, 2016. |
|
| Figure 1. Fibonacci analysis is a fantastic tool in determining very precise support/resistance areas. |
| Graphic provided by: BigCharts.com. |
| |
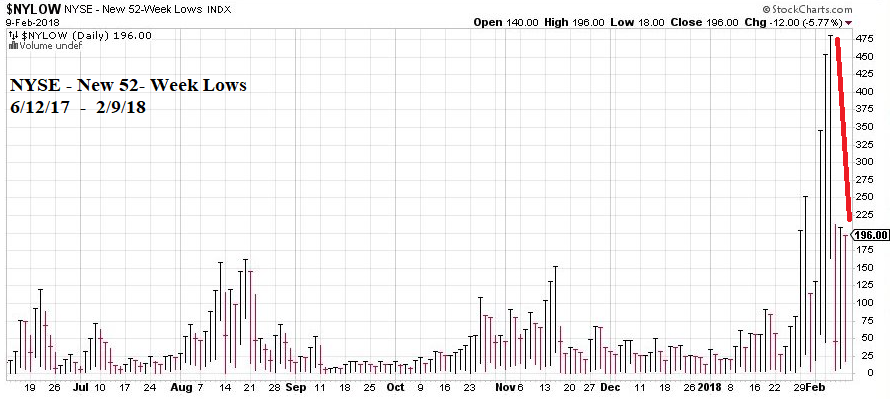
| Momentum Dimension Please see the NYSE-New 52-week Lows chart illustrated in Figure 2. On February 9 the number of new 52-week lows was only 196, down significantly from the 480 new lows recorded at the higher SPX low made on February 6. This indicates that in the short term the bears are spent. On the longer term the closest decline to the current mini crash was the August 2015 mini crash. During that decline there were a maximum 1554 new lows recorded on August 25, 2015, more than three times the February 2018 decline. This could mean that internally the February 2018 decline is much weaker than the August 2015 drop. Or that in a few weeks there's room for increased bearishness. |
|
| Figure 2. On February 9 the number of new 52-week lows was only 196, down significantly from the 480 new lows recorded at the higher SPX low made on February 6. |
| Graphic provided by: StockCharts.com. |
| |
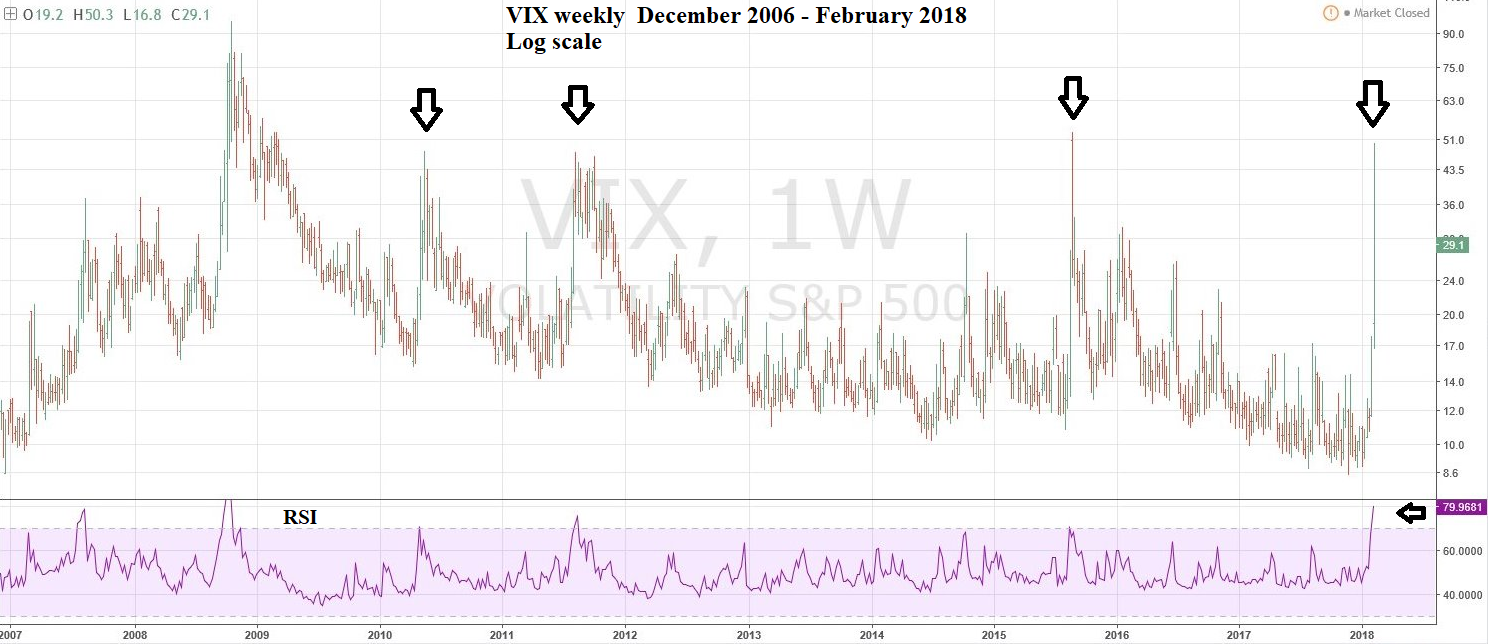
| Sentiment Dimension Please see the weekly VIX chart illustrated in Figure 4. On February 9 the VIX hit a maximum of 41.10 vs. a maximum VIX of 50.30 registered on February 6 when the SPX was at a higher low. This is another sign that in the short-term stock bears are depleted. On the longer term note that the VIX in October 2008 reached a maximum of 96.40 — again a sign there's room for more bearish action. |
|
| Figure 3. On February 9 the VIX hit a maximum of 41.10 vs. a maximum VIX of 50.30 registered on February 6 when the SPX was at a higher low. |
| Graphic provided by: Tradingview.com. |
| |
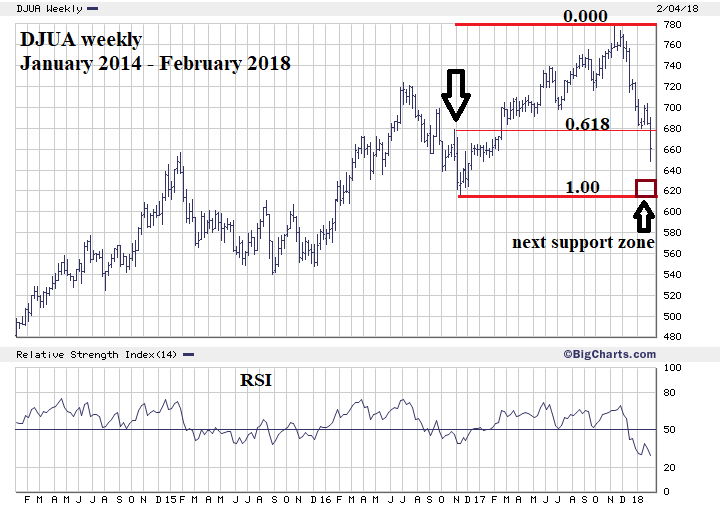
| Dow Jones Utility Average - Update Please see the Dow Jones Utility Average (DJUA) chart illustrated in Figure 4. Powerful force is needed to breach powerful support/resistance. What happened to the DJUA in early February 2018 is a perfect example of powerful support being breached. My January 25 article "Utility Stock Bargains" noted significant support in the DJUA zone of 678 to 680. The recommendation made was, "If the DJUA is in the range of 684 to 675, go long Utility stocks or funds. Use DJUA 673 as a stop loss." The very close stop to the buy zone was a recognition that powerful force was needed to breach powerful support. On February 5 the DJUA broke below 673 limiting losses to a maximum of 1.6%. The next trading day the DJUA gapped down and went as low as 649.76 — a wider stop would have caused significantly greater losses. Critics of technical analysis will point to examples of failures to forecast a turn as proof that a methodology is useless. Yet, it not just about correctly anticipating where prices could go. It's equally important to know when to get out of a position when you are on the wrong side of a trend. Fibonacci analysis is perhaps the best methodology to use in placing close stops to protect precious trading capital. |
|
| Figure 4. Powerful force is needed to breach powerful support/resistance. |
| Graphic provided by: BigCharts.com. |
| |
| Conclusion and Strategy In the short term the stock market bears are exhausted, spent and depleted. With three Fibonacci coordinates, support at the 200-day SMA, sentiment and momentum divergences probabilities are high that the bulls are back in control. The SPX has a very good chance to reach major Fibonacci resistance at 3047 sometime in May 2018. Please see my February 1st article "How High is Up". The DJUA broke major support and could be drawn down to the next significant support zone of 616-630. Stand aside on the DJUA. As for the broader US stock market, the strongest evidence that the bears could continue the drive to the downside is the briefness of the recent drop, which in the SPX is only ten trading days into the February 9 bottom. It could mean that Minor wave "4" is still under construction. Elliott wave Horizontal Triangles are a typical wave "four" price pattern. Horizontal Triangles go sideways and are choppy. After weeks of racing to the upside followed by a rapid move down, it would be logical to expect are period of range trading for the next few weeks. SPX 2532.69 is very powerful support; a breach of this level could lead to a crash. Avoid new long positions until the SPX can establish a support level above 2532.69. On February 9 the bulls did battle with full force and were victorious. We need to beware of a subsequent bear counter attack. If the low made on February 9 is broken, SPX 2532.69 could become deadly ground for the bulls. Further Reading: Frost A.J and Robert Prechter (1985) "Elliott Wave Principle", New Classics Library. |
Independent investment advisor, trader and writer. He has written articles for Technical Analysis of Stocks & Commodities, Traders.com Advantage,Futuresmag.com and, Finance Magnates. Author of website Four Dimension Trading.
| Website: | www.fourdimensiontrading.com |
| E-mail address: | markrivest@gmail.com |
Click here for more information about our publications!
PRINT THIS ARTICLE

Request Information From Our Sponsors
- StockCharts.com, Inc.
- Candle Patterns
- Candlestick Charting Explained
- Intermarket Technical Analysis
- John Murphy on Chart Analysis
- John Murphy's Chart Pattern Recognition
- John Murphy's Market Message
- MurphyExplainsMarketAnalysis-Intermarket Analysis
- MurphyExplainsMarketAnalysis-Visual Analysis
- StockCharts.com
- Technical Analysis of the Financial Markets
- The Visual Investor
- VectorVest, Inc.
- Executive Premier Workshop
- One-Day Options Course
- OptionsPro
- Retirement Income Workshop
- Sure-Fire Trading Systems (VectorVest, Inc.)
- Trading as a Business Workshop
- VectorVest 7 EOD
- VectorVest 7 RealTime/IntraDay
- VectorVest AutoTester
- VectorVest Educational Services
- VectorVest OnLine
- VectorVest Options Analyzer
- VectorVest ProGraphics v6.0
- VectorVest ProTrader 7
- VectorVest RealTime Derby Tool
- VectorVest Simulator
- VectorVest Variator
- VectorVest Watchdog