

HOT TOPICS LIST
- MACD
- Fibonacci
- RSI
- Gann
- ADXR
- Stochastics
- Volume
- Triangles
- Futures
- Cycles
- Volatility
- ZIGZAG
- MESA
- Retracement
- Aroon
INDICATORS LIST
LIST OF TOPICS
PRINT THIS ARTICLE
by Mark Rivest
See why this index could give clues for a global stock market decline.
Position: N/A
Mark Rivest
Independent investment advisor, trader and writer. He has written articles for Technical Analysis of Stocks & Commodities, Traders.com Advantage,Futuresmag.com and, Finance Magnates. Author of website Four Dimension Trading.
PRINT THIS ARTICLE
ELLIOTT WAVE
Signals From The Hang Seng
05/03/18 02:57:03 PMby Mark Rivest
See why this index could give clues for a global stock market decline.
Position: N/A
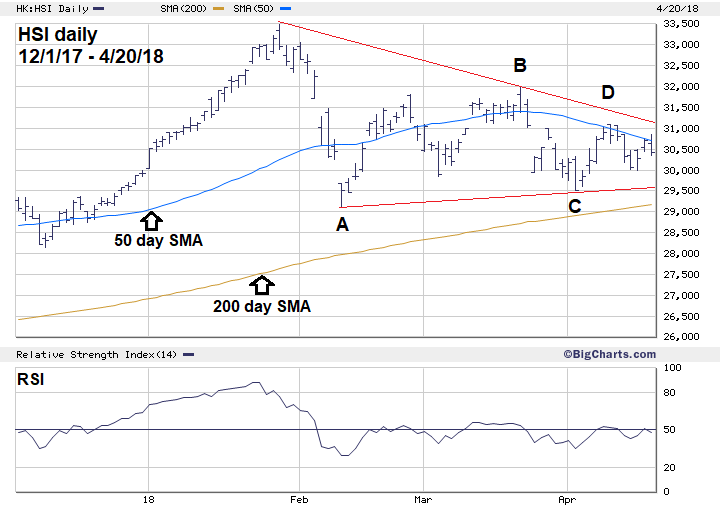
| The Hang Seng index (HSI) is used to monitor the daily changes of the largest companies of the Hong Kong stock market. This index may have completed an Elliott wave corrective pattern which implies new all-time highs in May. On the bearish side of the coin a break below this index's February 9 bottom could trigger a global stock market crash. Hang Seng Daily If you don't trade Hong Kong stocks you may be asking, why should I follow the HSI? The reason — sometimes the price patterns of one national stock index could confirm the pattern another national stock index. In this case the HSI appears to be confirming the actions of the S&P 500 (SPX). Please see the HSI daily chart illustrated in Figure 1. In my February 15 article "S&P 500 - Deadly Ground" I speculated that the recent SPX decline was brief, and that an Elliott wave horizontal triangle could be forming. In mid-April that appears to be what's happening for both the HSI and SPX. Horizontal triangles correct the progress of the main trend. The pattern sub-divides into five waves and most of the time contracts in a sideways wedge. In standard technical patterns this is referred to as an indecision triangle. It's possible that the HSI triangle could be complete at the bottom made on April 18 at 29979.40. If not yet complete the supposed wave "E" low could be in place within a few trading days. After completion of the horizontal triangle, the HSI could have a very rapid rally and exceed the peak made on January 29. On the bearish side, a break below the supposed wave "C" bottom at 29518.70 made on April 4 would put the supposed horizontal triangle pattern in doubt. The April 4 bottom is only 1.3% above the February 9 bottom. If the bears can breach the 29518.70 bottom they could then mount an attack of the February 9 low — which if broken would eliminate the horizontal triangle count. This could be the trigger for break of the SPX very important bottom of 2532 made of February 9. |
|
| Figure 1. It's possible that the HSI triangle could be complete at the bottom made April 18 at 29979.40. |
| Graphic provided by: BigCharts.com. |
| |
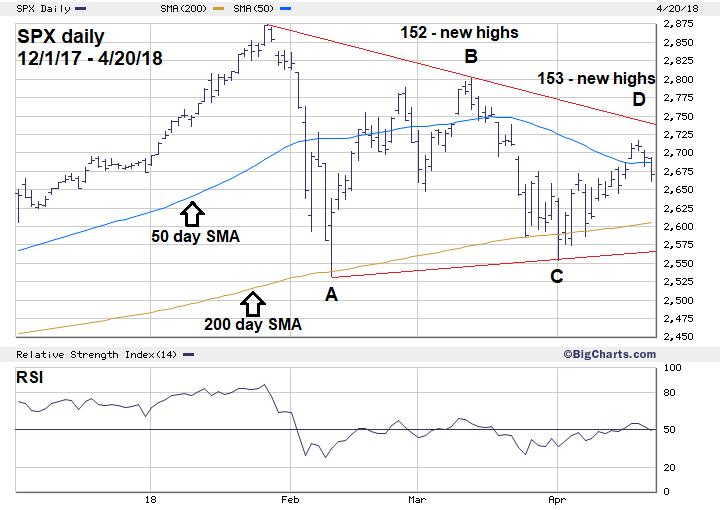
| S&P 500 Daily Please see the SPX daily chart illustrated in Figure 2. The SPX appears to be in, or has completed, wave "E" of a horizontal triangle. Evidence from the dimension of Momentum gives a strong clue that the SPX could soon be trading above its January 26 peak. On March 13 the SPX high was 2801.90 with 152-NYSE new highs. On April 18 the SPX high was 2717.49 — 3% below the March 13 top yet there were 153 NYSE stocks recording new 52-week highs. Underneath the surface the bulls are in control. In the Sentiment dimension the picture is mixed. In my April 6 article I noted that March 23 the CBOE Options Total Put/Call ratio hit 1.54 — its highest level since August of 2015. The higher P/C ratio vs. the lower P/C ratio recorded on February 9 is a signature of a horizontal triangle correcting a bullish trend. However, on April 2 the SPX went below the bottom made on March 23 with a P/C ratio of 1.28 below the level recorded on March 23 and the 1.32 reading made on February 9. The supposed "C" wave bottom recorded on April 2 is important support. If the SPX were to break below 2553.80 it would be easy for the bears to challenge very important support at 2532.69. As noted in several of my articles the SPX would then be decisively below its 200-day SMA and below the bottom of the last correction. This condition has not existed since August of 2015, and that resulted in a mini crash. Also note that the SPX 50-day SMA is beginning to head towards the 200-day SMA. My April 19 article "The Death Cross" illustrated that if the 50-day SMA crosses the 200-day SMA it will probably come too late to be an effective sell signal. A break below SPX 2553.80 is the focal point. |
|
| Figure 2. Evidence from the dimension of Momentum gives a strong clue that the SPX could soon be trading above its January 26 peak. |
| Graphic provided by: BigCharts.com. |
| |
| Summary As of April 20, the HSI is 4.4% above its very important February 9 bottom. The SPX is 5.4% above its February 9 bottom. The HSI is the lead dog and the index to watch. If the HSI breaks below its April 4 bottom it could be an early warning signal of a coming SPX break down. In late April 2018 both the HSI and SPX are in an interesting situation, they could be poised for a rally to new all-time highs or on the verge of a rapid 15% decline. It's easy to make market calls, what's not easy is changing your opinion when a market changes direction and goes opposite to your original expectation. Great traders can quickly change their opinions — they not only save their profits but make even more profits by trading with a change in market direction. Late April/early May the stock market is poised for big moves in either direction. This could be a time to test your greatness. Further Reading: Frost A.J and Robert Prechter (1985) "Elliott Wave Principle", New Classics Library. Rivest Mark (2018) "The Four Market Dimensions" Technical Analysis of Stocks & Commodities, Volume 36: May. |
Independent investment advisor, trader and writer. He has written articles for Technical Analysis of Stocks & Commodities, Traders.com Advantage,Futuresmag.com and, Finance Magnates. Author of website Four Dimension Trading.
| Website: | www.fourdimensiontrading.com |
| E-mail address: | markrivest@gmail.com |
Click here for more information about our publications!
PRINT THIS ARTICLE

Request Information From Our Sponsors
- StockCharts.com, Inc.
- Candle Patterns
- Candlestick Charting Explained
- Intermarket Technical Analysis
- John Murphy on Chart Analysis
- John Murphy's Chart Pattern Recognition
- John Murphy's Market Message
- MurphyExplainsMarketAnalysis-Intermarket Analysis
- MurphyExplainsMarketAnalysis-Visual Analysis
- StockCharts.com
- Technical Analysis of the Financial Markets
- The Visual Investor
- VectorVest, Inc.
- Executive Premier Workshop
- One-Day Options Course
- OptionsPro
- Retirement Income Workshop
- Sure-Fire Trading Systems (VectorVest, Inc.)
- Trading as a Business Workshop
- VectorVest 7 EOD
- VectorVest 7 RealTime/IntraDay
- VectorVest AutoTester
- VectorVest Educational Services
- VectorVest OnLine
- VectorVest Options Analyzer
- VectorVest ProGraphics v6.0
- VectorVest ProTrader 7
- VectorVest RealTime Derby Tool
- VectorVest Simulator
- VectorVest Variator
- VectorVest Watchdog