

HOT TOPICS LIST
- MACD
- Fibonacci
- RSI
- Gann
- ADXR
- Stochastics
- Volume
- Triangles
- Futures
- Cycles
- Volatility
- ZIGZAG
- MESA
- Retracement
- Aroon
INDICATORS LIST
LIST OF TOPICS
PRINT THIS ARTICLE
by Mark Rivest
US main stock indices have returned to important support. See what the technical indicators are saying.
Position: N/A
Mark Rivest
Independent investment advisor, trader and writer. He has written articles for Technical Analysis of Stocks & Commodities, Traders.com Advantage,Futuresmag.com and, Finance Magnates. Author of website Four Dimension Trading.
PRINT THIS ARTICLE
MARKET TIMING
US Stock Market at Support or Prelude to Crash
04/06/18 10:56:44 AMby Mark Rivest
US main stock indices have returned to important support. See what the technical indicators are saying.
Position: N/A
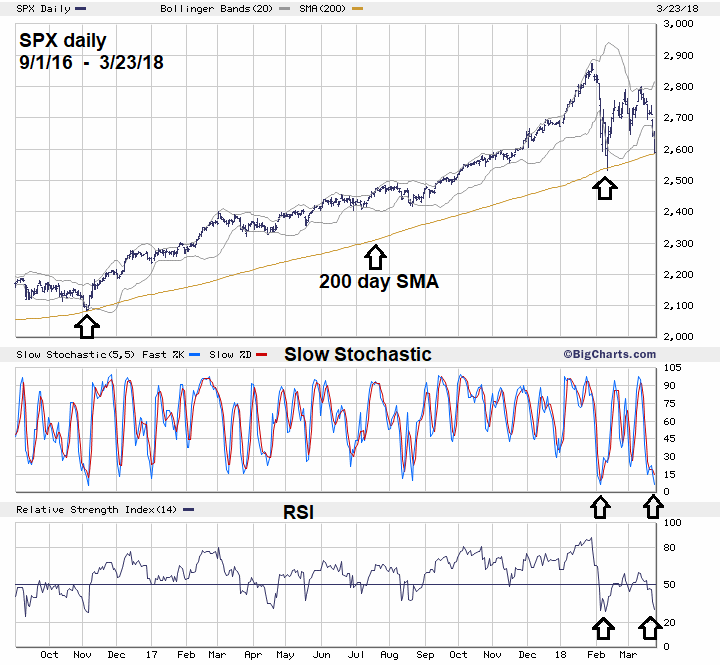
| The February 9, 2018 US stock market mini crash bottom is very important because the S&P 500 (SPX) also hit and bounced off its 200-day Simple Moving Average (SMA). Most, if not all stock fund managers base their performance relative to the SPX. The 200-day SMA is perhaps the most widely followed technical indicator. It's probable that if the 200-day SMA is breached along with a breach of the SPX low made on February 9 it could trigger fund managers into selling stocks. If enough fund managers follow the same sell signal it could cause the SPX to rapidly decline to major support made at the November 2016 bottom. Price Dimension As traders we always need to keep an open mind to all possibilities. No one has a magic crystal ball that can see into the future, therefore we rely on the weight of evidence and go with the probabilities. At the same time, we need to be aware that sometimes the markets could move against the evidence. Low probability does not mean no probability — that's why we use stop loss protection. On March 23 the US stock market registered several bullish signals that strongly imply an intermediate bottom is in place or could be on the next trading day. Please see the SPX daily chart illustrated in Figure 1. Two potentially powerful bullish signals are on this chart. First, the SPX is again right back at the 200-day SMA just as it was back in early November 2016 and in February 2018. We could know in just a few trading days if this important line will again be support. Secondly, note that on March 23 the SPX was far below the lower Bollinger band very similar to February 9 bottom. This type of Bollinger band signal works especially well when momentum oscillators reach the oversold zone. Both the RSI and Slow Stochastics are at the same oversold levels that were recorded on February 9. Another piece of bullish evidence comes from Fibonacci analysis. In my February 15 article "S&P 500 - Deadly Ground" I speculated that recent SPX decline which lasted ten trading days was brief, and that an Elliott wave Horizontal Triangle could be forming. As of March 23, this looks like what is happening. Sometimes there will be Fibonacci relationships between adjacent sub waves of the Horizontal Triangle, such as wave "A" is related to "C" and wave "B" is related to wave "D". The supposed wave "A" — the January to February SPX mini crash — was 340.18 points multiplied by .618 equals 210.23. The supposed "B" wave top on March 13 was 2801.90. Subtracting 210.23 from 2801.90 targets SPX 2591.67. The low point on March 23 was 2585.89. If needed I will have more about this possible Horizontal Triangle in a future article. |
|
| Figure 1. SPX is again right back at the 200�day SMA just as it was back in early November 2016 and in February 2018. |
| Graphic provided by: BigCharts.com. |
| |
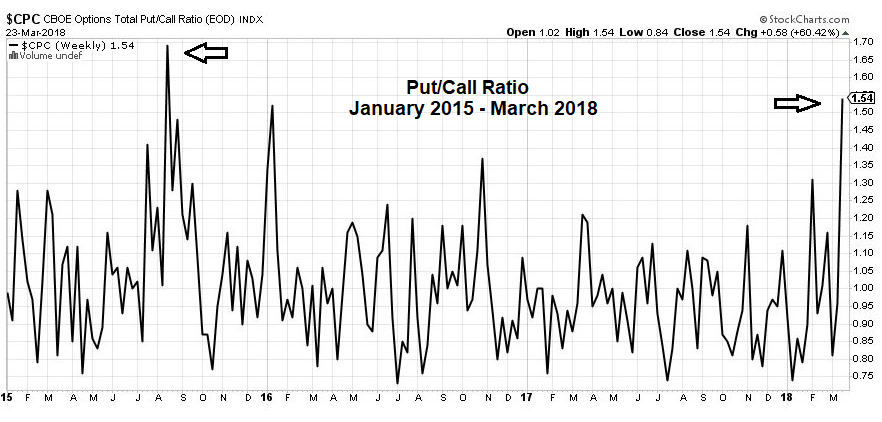
| Sentiment Dimension Please see the weekly CBOE Options Total Put/Call ratio illustrated in Figure 2. On March 23 the Put/Call ratio reach 1.54 — this is the highest levels since the August 2015 mini crash! Also note that the ratio is higher than it was at the February 9, 2018 bottom. This is additional proof that a Horizontal Triangle could be forming. When a Horizontal Triangle is correcting, progress within a bull market sentiment gets more bearish at higher levels as the triangle contracts. This is the opposite of what normally happens, which is higher Put/Call readings at lower prices. Market Vane - Bullish Consensus readings for stocks back up the evidence from the Put/Call ratio. The Bullish Consensus reading for the week March 19-23 was 60%. This is the lowest since the first two weeks of November 2016 which were 57% and 59%. Early November 2016 was the low of the last correction prior to the relentless November 2016 to January 2018 rally. |
|
| Figure 2. On March 23 the Put/Call ratio reached 1.54. This is the highest levels since the August 2015 mini crash! |
| Graphic provided by: StockCharts.com. |
| |
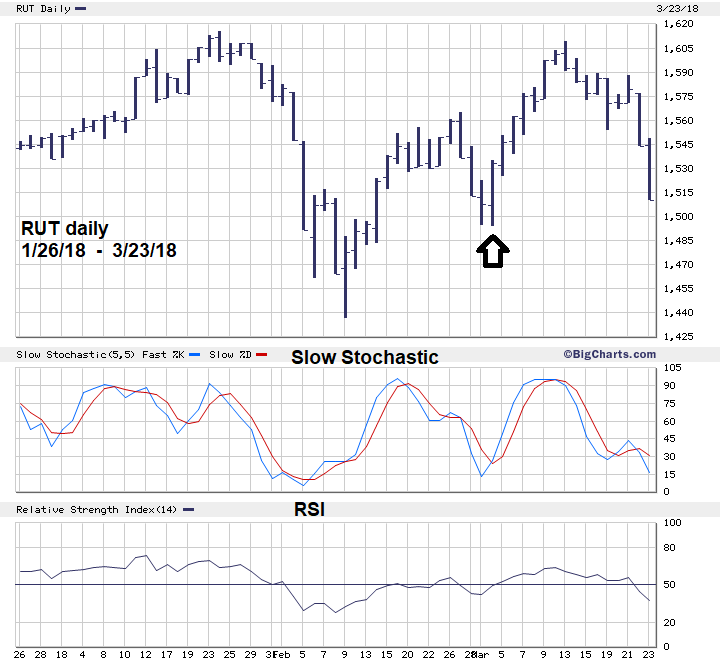
| Momentum Dimension The strongest evidence that the US stock market is not in the early phase of a much larger decline comes from the Russell 2000 (RUT) small cap stock index. Please see the RUT daily chart illustrated in Figure 3. When stock markets have large declines such as greater than 15% it's usually because the economy is weakening. When large declines begin the strongest companies hold up the best and generally their stocks are the last to top out. The strongest companies are the largest and most well established. Conversely, the weakest companies are the smallest and relatively young. When a large stock market decline begins the small cap stock should at least be declining at the same rate or greater than the general stock market. So why is the RUT from its secondary peak made on March 13 declining less than the general stock market? This is a comparison of the RUT's post February 9, 2018 rally and subsequent retracement to the Nasdaq Composite (COMP), SPX, and Dow Jones Industrial Average (DJIA). Note the RUT, COMP, and SPX post February 9 rallies ended on March 13 while the DJIA rally ended on February 27. RUT - retracement = 57.3% COMP - retracement = 64.0% SPX - retracement = 80.2% DJIA -retracement = 93.9% Also, on March 2 all four indices made a secondary bottom, as of March 23 RUT was above this secondary bottom while the other three indices were below this low. If this is the beginning of a larger stock market decline it's very unusual to have the stocks of the weakest and youngest companies behaving stronger than the general stock market. |
|
| Figure 3. When a large stock market decline begins the small cap stocks should at least be declining at the same rate or greater than the general stock market. |
| Graphic provided by: BigCharts.com. |
| |
| Conclusion About once or twice a year any market will have combined signals from all four dimensions of; Price, Time, Momentum, and Sentiment. In the dimension of Time, the US stock market is seasonally bullish until April/May. There are strong bullish signals from the other three dimensions, especially the sentiment dimension. On the other side of the coin is the extremely important support at the SPX February 9 bottom. As of March 23, there appears to be a chance for at least a short-term bounce. We could know in as soon as two weeks from March 23 if the US stock market is in a rally to a new all-time high or in a vicious bear market. Further Reading: Frost A.J and Robert Prechter (1985) "Elliott Wave Principle", New Classics Library. Hadady R. Earl (1983) "Contrary Opinion", Key Books. |
Independent investment advisor, trader and writer. He has written articles for Technical Analysis of Stocks & Commodities, Traders.com Advantage,Futuresmag.com and, Finance Magnates. Author of website Four Dimension Trading.
| Website: | www.fourdimensiontrading.com |
| E-mail address: | markrivest@gmail.com |
Click here for more information about our publications!
Comments

Request Information From Our Sponsors
- StockCharts.com, Inc.
- Candle Patterns
- Candlestick Charting Explained
- Intermarket Technical Analysis
- John Murphy on Chart Analysis
- John Murphy's Chart Pattern Recognition
- John Murphy's Market Message
- MurphyExplainsMarketAnalysis-Intermarket Analysis
- MurphyExplainsMarketAnalysis-Visual Analysis
- StockCharts.com
- Technical Analysis of the Financial Markets
- The Visual Investor
- VectorVest, Inc.
- Executive Premier Workshop
- One-Day Options Course
- OptionsPro
- Retirement Income Workshop
- Sure-Fire Trading Systems (VectorVest, Inc.)
- Trading as a Business Workshop
- VectorVest 7 EOD
- VectorVest 7 RealTime/IntraDay
- VectorVest AutoTester
- VectorVest Educational Services
- VectorVest OnLine
- VectorVest Options Analyzer
- VectorVest ProGraphics v6.0
- VectorVest ProTrader 7
- VectorVest RealTime Derby Tool
- VectorVest Simulator
- VectorVest Variator
- VectorVest Watchdog