

HOT TOPICS LIST
- MACD
- Fibonacci
- RSI
- Gann
- ADXR
- Stochastics
- Volume
- Triangles
- Futures
- Cycles
- Volatility
- ZIGZAG
- MESA
- Retracement
- Aroon
INDICATORS LIST
LIST OF TOPICS
PRINT THIS ARTICLE
by Mark Rivest
See the effectiveness of the Death Cross and Golden Cross signals.
Position: N/A
Mark Rivest
Independent investment advisor, trader and writer. He has written articles for Technical Analysis of Stocks & Commodities, Traders.com Advantage,Futuresmag.com and, Finance Magnates. Author of website Four Dimension Trading.
PRINT THIS ARTICLE
MOVING AVERAGES
The Death Cross
04/19/18 04:22:51 PMby Mark Rivest
See the effectiveness of the Death Cross and Golden Cross signals.
Position: N/A
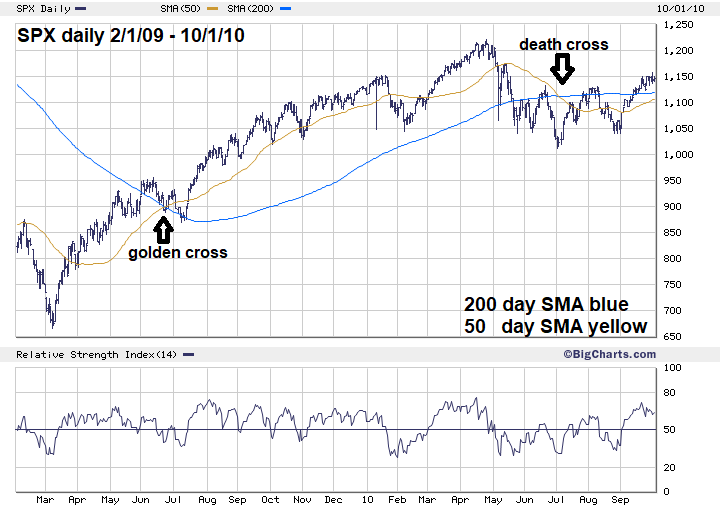
| The 200-day simple moving average (SMA) is a widely followed indicator for nearly all markets. When analyzing the US stock market, the 200-day SMA is most effective when applied to the S&P 500 (SPX) index. This is because most, if not all, stock fund managers base their performance off the SPX. Signals to sell are generated when the 50-day SMA crosses below the 200-day SMA referred to as "the death cross". Buy signals known as "the golden cross" occur when the 50-day SMA crosses above the 200-day SMA. A review of the prior ten years shows the effectiveness of these signals. S&P 500 - February 2009-October 2010 A golden cross signal came in June 2009 at approximately SPX 900. Please see the daily SPX chart 2/1/09 - 10/1/10 illustrated in Figure 1. After an initial marginal rally, the SPX declined to the 967 areas. This was only a 3.5% decline below the signal point. If trading a one for one Exchange Traded Fund (ETF) related to the SPX this would be within the range of a stop-loss placed at 5 to 7%. This was an effective buy signal. The SPX subsequently rallied for several months and a one to one ETF could have yielded a profit of 20 to 25% if sold late 2009 or early 2010. The death cross signal came in early July 2010, well after the intermediate peak in April 2010. The sell signal came almost at the exact time of what turned out to be a very important bottom at SPX 1010. This was an ineffective sell signal. Also note the series of short-term bottoms recorded between August 2009 and November 2009. This could have been an important factor as why the 2010 decline did not continue longer and lower. |
|
| Figure 1. The sell signal came almost at the exact time of what turned out to be a very important bottom at SPX 1010. |
| Graphic provided by: BigCharts.com. |
| |
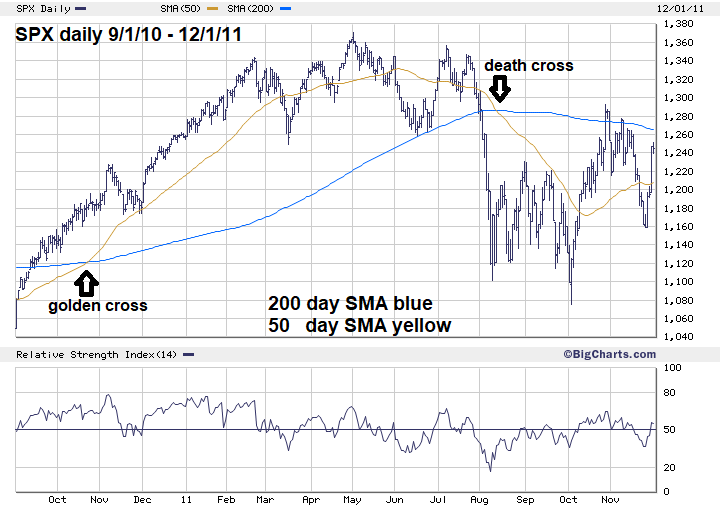
| S&P 500 - September 2010-December 2011 Please see the daily SPX chart 9/1/10 - 12/1/11 illustrated in Figure 2. There was a golden cross signal in October 2010 at about SPX 1120. This was also an effective buy signal. By late January to February 2011 a trader could have realized profits in the range of 14 to 18%. After a multi-month topping period a death cross signal came in August 2011. Again, this signal came very close to an important bottom 1101. The SPX subsequently went to 1074 in October 2011, but a trader would have to endure a loss greater than 10% - beyond a reasonable stop level to achieve a marginal gain. An ineffective signal. Also note that the SPX rally from September 2010 to February 2011 was very smooth with only one small correction in November 2010. In August 2011 when the SPX broke decisively below the 200-day SMA and important support at 1249 it triggered a mini crash. This contrasts with the SPX 2010 decline which had several short-term bottoms that may have deterred a larger decline. |
|
| Figure 2. After a multi�month topping period a death cross signal came in August 2011. Again, this signal came very close to an important bottom 1101. |
| Graphic provided by: BigCharts.com. |
| |
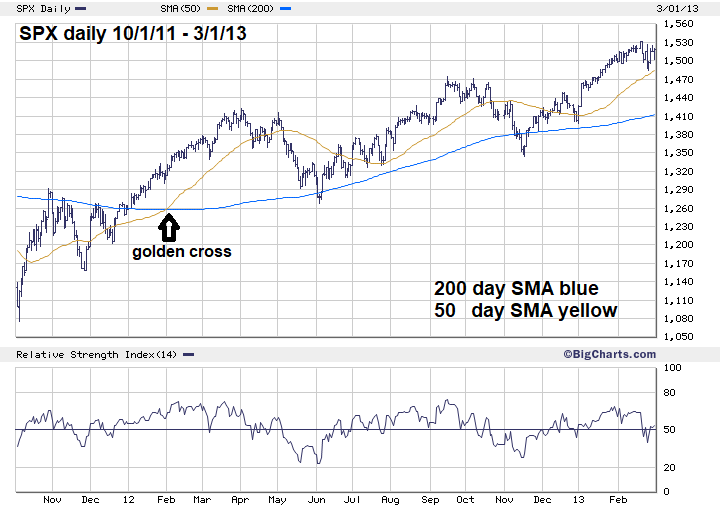
| S&P 500 - October 2011-March 2013 Please see the daily SPX chart 10/1/11 - 3/1/13 illustrated in Figure 3. The buy signal in early February 2012 took longer to generate a rally greater than ten percent as there was a subsequent decline in late May to early June. The bottom of this decline was at SPX 1266, holding above the golden cross level of 1260. By September the SPX was 16% above 1260. An effective signal. |
|
| Figure 3. By September the SPX was 16% above 1260. An effective signal. |
| Graphic provided by: BigCharts.com. |
| |
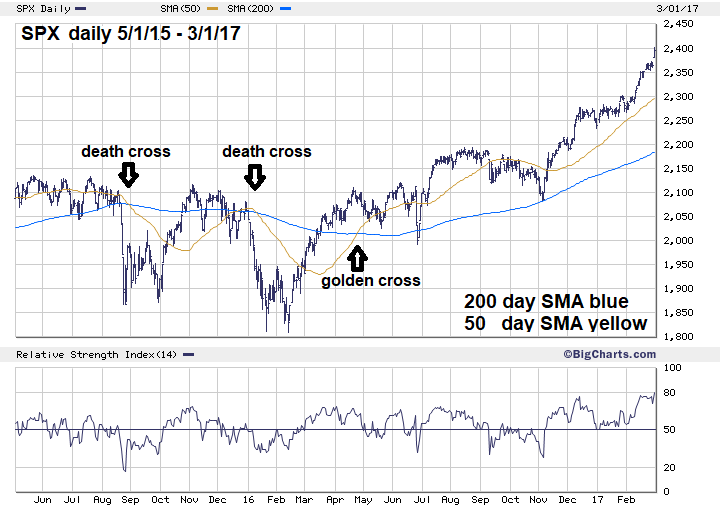
| S&P 500 - May 2015-March 2017 Please see the daily SPX chart 05/01/15 - 03/01/17 illustrated in Figure 4. In August 2015, four years after the last death cross, the 50-day SMA went below the 200-day SMA. Note that before this signal the SPX broke decisively below the 200-day SMA and important support at 2044, creating a mini crash like August 2011. Please see my May 27, 2015 article "The Battlefield" and my August 10, 2015 article "Analyze This". Two very interesting factors about the August 2015 sell signal: It came after the crash bottom and the financial news media were screaming, "death cross, death cross, death cross!" This was a very ineffective sell signal. In early January 2016 there was another death cross, this time with much less media attention. This signal provided enough time to at least make a marginal profit on the short side. There was a golden cross in May 2016 that produced only a marginal gain, then a decline brought the SPX just 1% below the entry point. The SPX then rallied only 8% before another correction began. For the multi-month trader, a mediocre buy signal at best. |
|
| Figure 4. Note that before the August signal the SPX broke decisively below the 200�day SMA and important support at 2044, creating a mini crash like August 2011. |
| Graphic provided by: BigCharts.com. |
| |
| Conclusion Since early February 2018 the SPX has been testing the 200-day SMA. As of April 6, the SPX is continuing to hold above very important support at SPX 2532. If the SPX breaks significantly below the 200-day SMA and this important support, there could be at least a mini-crash like what happened in 2011 and 2015. If you use the death cross as a signal to go short it's possible the SPX could be at or near a bottom. The last time the death cross was effective in signaling a short entry was in December 2007 — the early part of a huge bear market. This signal with the four from 2009 to 2016 means the death cross is effective just 20% of the time. The golden cross from 2009 to 2016 signaled rallies greater than 10% three out of four times, so 75% effective. If the SPX can break below support at 2532 and produces a death cross, the profits from short selling could be marginal. If the Financial media shouts, "death cross, death cross, death cross", it could be a signal to go long. |
Independent investment advisor, trader and writer. He has written articles for Technical Analysis of Stocks & Commodities, Traders.com Advantage,Futuresmag.com and, Finance Magnates. Author of website Four Dimension Trading.
| Website: | www.fourdimensiontrading.com |
| E-mail address: | markrivest@gmail.com |
Click here for more information about our publications!
Comments
Date:�04/19/18Rank:�4Comment:�
Date:�04/27/18Rank:�5Comment:�

Request Information From Our Sponsors
- VectorVest, Inc.
- Executive Premier Workshop
- One-Day Options Course
- OptionsPro
- Retirement Income Workshop
- Sure-Fire Trading Systems (VectorVest, Inc.)
- Trading as a Business Workshop
- VectorVest 7 EOD
- VectorVest 7 RealTime/IntraDay
- VectorVest AutoTester
- VectorVest Educational Services
- VectorVest OnLine
- VectorVest Options Analyzer
- VectorVest ProGraphics v6.0
- VectorVest ProTrader 7
- VectorVest RealTime Derby Tool
- VectorVest Simulator
- VectorVest Variator
- VectorVest Watchdog
- StockCharts.com, Inc.
- Candle Patterns
- Candlestick Charting Explained
- Intermarket Technical Analysis
- John Murphy on Chart Analysis
- John Murphy's Chart Pattern Recognition
- John Murphy's Market Message
- MurphyExplainsMarketAnalysis-Intermarket Analysis
- MurphyExplainsMarketAnalysis-Visual Analysis
- StockCharts.com
- Technical Analysis of the Financial Markets
- The Visual Investor