HOT TOPICS LIST
- MACD
- Fibonacci
- RSI
- Gann
- ADXR
- Stochastics
- Volume
- Triangles
- Futures
- Cycles
- Volatility
- ZIGZAG
- MESA
- Retracement
- Aroon
INDICATORS LIST
LIST OF TOPICS
PRINT THIS ARTICLE
by Mark Rivest
Russell 2000 hits significant resistance, a major decline may have begun.
Position: N/A
Mark Rivest
Independent investment advisor, trader and writer. He has written articles for Technical Analysis of Stocks & Commodities, Traders.com Advantage,Futuresmag.com and, Finance Magnates. Author of website Four Dimension Trading.
PRINT THIS ARTICLE
MARKET TIMING
Have US Small Cap Stocks Topped?
06/28/18 03:22:07 PMby Mark Rivest
Russell 2000 hits significant resistance, a major decline may have begun.
Position: N/A
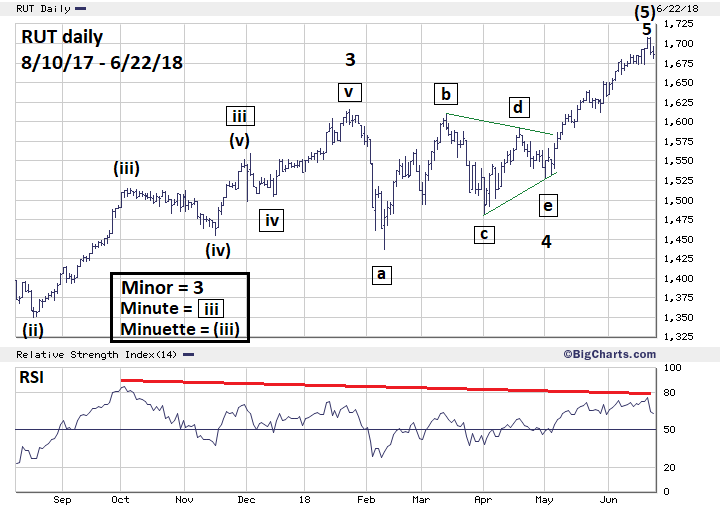
| During the later stage of a stock bull market, small cap stocks typically will surge and out perform large cap stocks. The reason for this phenomenon is simple, after years of rising stock prices, the crowd is now comfortable with taking greater risk. In May of 2018 the Russell 2000 small cap stock index (RUT) made a new all-time high, unconfirmed by the S&P 500 (SPX). For several weeks the RUT surged up while the SPX labored higher and stayed below its all-time high. On June 20 RUT reached important resistance, a bear market lasting months or years may have started. Russell 2000 Daily Please see the daily RUT chart illustrated in Figure 1. On June 20 the RUT may have completed a five wave Elliott pattern from the February 2016 bottom. For clarity, only the last part of the wave count from February 2016 is shown. In my February 15, 2018 article "S&P 500 - Deadly Ground" I speculated that after the January top an Elliott wave Horizontal Triangle could be forming. For the RUT this is exactly what's happened. The course taken by RUT from January 24-May 1 is a textbook example of a Horizontal Triangle. After completion of a Horizontal Triangle there's usually a sharp thrust in the direction of the primary trend, which in this case is up. The move up after completion of the Horizontal Triangle on May 1 is a textbook example of a post triangle thrust. Now comes the most fascinating part. Typically, the widest part of a Horizontal Triangle, when added to the triangles termination point, can forecast the completion point of the post triangle thrust. RUT's January to February decline was 179.09 points. The triangles end was the low on May 1 of 1527.71. Adding 179.09 to 1527.71 targets RUT 1706.80, the high on June 20 was 1708.09 — almost an exact hit! Finally, note the daily RSI bearish divergence. |

|
| Figure 1. The course taken by RUT from January 24-May 1 is a textbook example of a Horizontal Triangle. |
| Graphic provided by: BigCharts.com. |
| |
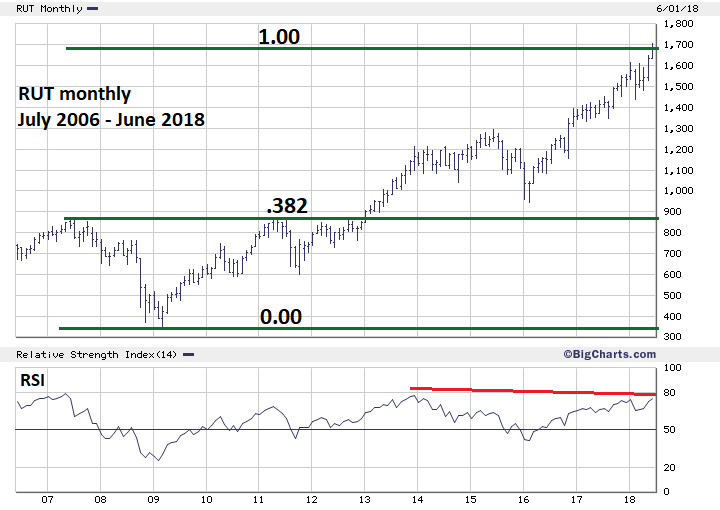
| Russell 2000 Monthly My June 8, 2015 article "The Golden Section" noted that the SPX might have completed a Fibonacci golden section at the May 2015 peak of 2134.72. This top turned out to be the 2015 SPX high and a prelude to the August 2015 mini crash. The same phenomenon could be happening to the RUT in 2018. Please see the monthly RUT chart illustrated in Figure 2. RUT'S colossal 2007-2009 bear market was 513.89 points, multiplied by the Fibonacci ratio of 2.618 equals 1345.36 points, adding this to the 2009 bottom of 342.59 targets RUT 1687.95. This is only 1.1% below the actual high of 1708.09, amazingly close considering this calculation covers a period of more than ten years. Additional evidence of major resistance comes from the Fibonacci sequence. The sequence is as follows (1, 1, 2, 3, 5, 8, 13, 21, 34, 55, 89, 144, ... to infinity). The RUT March 2009 bottom was 342.59, multiplied by the Fibonacci sequence number "5 "targets RUT 1712.95, again almost an exact hit of the June 20, 2018 high of 1708.08. Finally note the monthly RSI bearish divergence. |

|
| Figure 2. The RUT March 2009 bottom of 342.59 multiplied by the Fibonacci sequence number 5 targets RUT 1712.95. |
| Graphic provided by: BigCharts.com. |
| |
| Conclusion Textbook Elliott wave patterns, long and intermediate term Fibonacci resistance points reached, and bearish daily and monthly RSI bearish divergences indicate the RUT could have a significant top in place. June 20, 2018 was one day before the Summer Solstice, perhaps indicating a seasonal change for small cap stocks? The stock market is the best forecaster of economic turns, normally topping months before the economy weakens. Large companies are usually the strongest and last to top in a bull market. It's logical to expect the smaller, weaker companies' stocks to top out first. There's historic precedence; in 2000 RUT peaked on March 10 and the SPX topped on March 24. In 2007 the RUT high came on July 13 and the SPX topped on October 11. A powerful thrust is the most likely pattern after the conclusion of a Horizontal Triangle. The SPX probably completed its Horizontal Triangle on May 3 at 2594.62. Please see my May 24 article "Global Bullish Confirmation". Since May 3 the SPX rally has been anemic and could be forming another Elliott wave pattern. This will be discussed in a future article. The SPX could still reach major resistance in the 3050 area, possibly by July or August. Major support for the SPX is now 2594.62. If the RUT has peaked on June 20 we will probably see a role reversal with the SPX now relatively more bullish than RUT. Further Reading: Frost A.J and Robert Prechter (1985) "Elliott Wave Principle", New Classics Library. |
Independent investment advisor, trader and writer. He has written articles for Technical Analysis of Stocks & Commodities, Traders.com Advantage,Futuresmag.com and, Finance Magnates. Author of website Four Dimension Trading.
| Website: | www.fourdimensiontrading.com |
| E-mail address: | markrivest@gmail.com |
Click here for more information about our publications!
Comments
Date: 06/30/18Rank: 4Comment:

|

Request Information From Our Sponsors
- StockCharts.com, Inc.
- Candle Patterns
- Candlestick Charting Explained
- Intermarket Technical Analysis
- John Murphy on Chart Analysis
- John Murphy's Chart Pattern Recognition
- John Murphy's Market Message
- MurphyExplainsMarketAnalysis-Intermarket Analysis
- MurphyExplainsMarketAnalysis-Visual Analysis
- StockCharts.com
- Technical Analysis of the Financial Markets
- The Visual Investor
- VectorVest, Inc.
- Executive Premier Workshop
- One-Day Options Course
- OptionsPro
- Retirement Income Workshop
- Sure-Fire Trading Systems (VectorVest, Inc.)
- Trading as a Business Workshop
- VectorVest 7 EOD
- VectorVest 7 RealTime/IntraDay
- VectorVest AutoTester
- VectorVest Educational Services
- VectorVest OnLine
- VectorVest Options Analyzer
- VectorVest ProGraphics v6.0
- VectorVest ProTrader 7
- VectorVest RealTime Derby Tool
- VectorVest Simulator
- VectorVest Variator
- VectorVest Watchdog
