

HOT TOPICS LIST
- MACD
- Fibonacci
- RSI
- Gann
- ADXR
- Stochastics
- Volume
- Triangles
- Futures
- Cycles
- Volatility
- ZIGZAG
- MESA
- Retracement
- Aroon
INDICATORS LIST
LIST OF TOPICS
PRINT THIS ARTICLE
by Mark Rivest
Could September and October 2019 be down months for US stocks?
Position: N/A
Mark Rivest
Independent investment advisor, trader and writer. He has written articles for Technical Analysis of Stocks & Commodities, Traders.com Advantage,Futuresmag.com and, Finance Magnates. Author of website Four Dimension Trading.
PRINT THIS ARTICLE
SEASONAL TRADING
Bearish Months For The Stock Market
09/19/19 04:40:30 PMby Mark Rivest
Could September and October 2019 be down months for US stocks?
Position: N/A
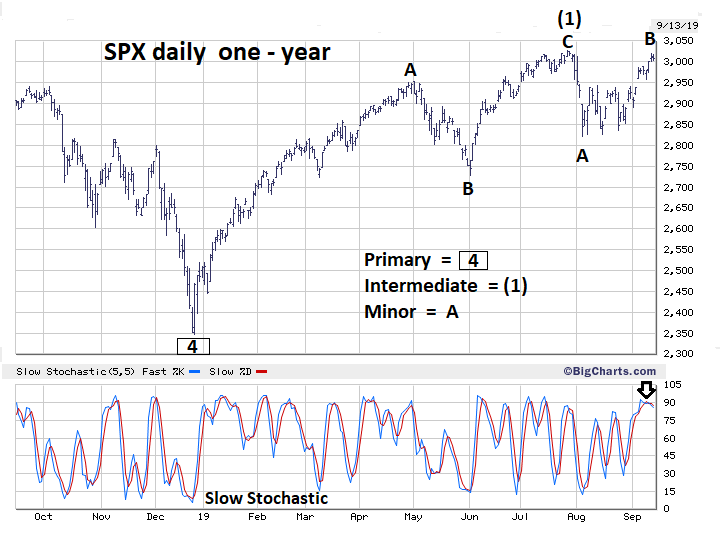
| Some market traders/analysts focus only on price patterns, forgetting that time can be a very important factor in market direction. No matter how bullish or bearish a price pattern can be, markets can change direction based on how long a trend has been in place, or seasonal factors. Almost all markets have some sort of seasonal bias. The US stock market is notorious for declining in the months of September and October — this reputation could be enhanced in 2019. S&P 500 - Daily Elliott wave patterns on any scale always have at least one alternative, or a different path a market could take. The Time dimension can be an aid in determining the most likely market direction. Please see the S&P 500 (SPX) daily chart illustrated in Figure 1. My August 15 article "The Final Pieces of a Ten-Year Puzzle?" noted the SPX from the December 26, 2018 bottom could be forming an Elliott wave Ending Diagonal Triangle (EDT). This pattern almost always forms within converging trendlines. My August 30 article "Stock Market Signals from the Sentiment Dimension" noted the situation had changed and the SPX was barely within a rising wedge. Also, the Dow Jones Industrial Average was now within a perfect parallel trend channel. The depth of the July to August decline put doubt into the theory that waves "one" through "four" of an EDT were complete. Seasonal analysis helps in discovering what could be the correct wave count. With the potential for a decline during the months of September and October, it's possible that the price structure that began on December 26 is only the first wave up of a larger developing EDT. Each of an EDT's sub waves including waves 1, 3, and 5 subdivides into a three-wave pattern. The movement up from December to July has the look of a three-wave pattern. The retracement after wave "one" of an EDT is usually deep — at least a Fibonacci .618 retrace. If this wave count is correct the SPX could decline to at least the 2600 level by mid to late October 2019. Momentum evidence from the Slow Stochastic shows a bear cross in overbought territory implying a new decline could come soon. On August 12 the SPX was less than eight points from the all-time, high possibly forming a double top. A move above SPX 3028 would put the count of wave "one" of an EDT in doubt. |
|
| Figure 1. If this wave count is correct the SPX could decline to at least the 2600 by mid to late October. |
| Graphic provided by: BigCharts.com. |
| |
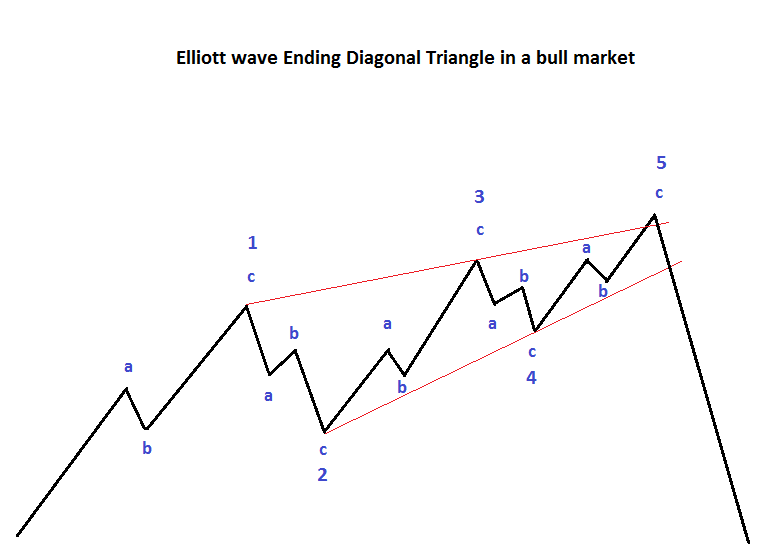
| Textbook - Ending Diagonal Triangle Please see the Elliott wave Ending Diagonal Triangle chart illustrated in Figure 2. If wave "one" of an EDT is complete the SPX could be in what is shown on this chart as lower case wave "c" of wave "2". Usually wave "three" of an EDT is slightly smaller in both price and time relative to wave "one". If the supposed wave "two" bottoms in October, the subsequent third wave up could peak in March or April of 2020. |
|
| Figure 2. If the supposed wave "two" bottoms in October, the subsequent third wave up could peak in March or April of 2020. |
| Graphic provided by: Mark Rivest. |
| |
| Dow Jones Transportation Average - Daily Please see the Dow Jones Transportation Average (DJTA) illustrated in Figure 3. The DJTA rally from December 2018 to April has the same three wave configuration as the SPX, however it's lagged significantly and has not exceeded its 2018 peak. Could the DJTA also be forming an EDT? Perhaps, but another pattern, a Horizontal Triangle, is more likely. This wave structure corrects the primary trend — unlike EDT's which terminate the primary trend. Each of the five sub waves also subdivide into three waves which when completed travel sideways instead of the up or down of an EDT. This supposed Horizontal Triangle has two interesting features. While each sub wave is composed of three parts, the three parts do not have to take the form of a Single Zigzag. The sub waves could also take the form of a Double Zigzag, Expanding Flat or even a smaller Horizontal Triangle usually found in the "E" wave position which extends the triangle from a five-wave to a nine-wave count. The decline from the DJTA April high illustrated as Intermediate wave (B) could be a developing Double Zigzag. In this situation the first A-B-C into the August bottom can also be illustrated as a wave "A" the subsequent wave "X" can also be shown as wave "B" and the supposed next A-B-C decline could be designated as wave "C". The most recent rally from the second late August bottom so far looks like a bullish five-wave pattern. However, it could be the final segment of an Expanding Flat which terminate in a five-wave. This supposed pattern would have begun at the mid-August bottom. Evidence supporting the Horizontal Triangle count comes from an extremely overbought Slow Stochastic and the DJTA hitting the declining trendline from the September 2018 top. |

|
| Figure 3. Horizontal Triangle's wave structure corrects the primary trend — unlike EDT�s which terminate the primary trend. |
| Graphic provided by: BigCharts.com. |
| |
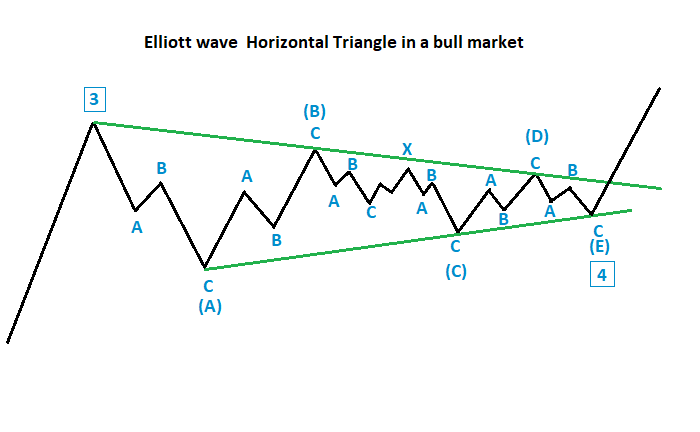
| Textbook - Horizontal Triangle Please see the Elliott wave Horizontal Triangle Illustrated in Figure 4. Note that wave "C" is composed of a Double Zigzag formation. This is what could be happening with the supposed DJTA forming wave (C). Typically, Horizontal Triangles will have at least two sub waves with Double Zigzags. |
|
| Figure 4. Typically, Horizontal Triangles will have at least two sub waves with Double Zigzags. |
| Graphic provided by: Mark Rivest. |
| |
| What time is it on the market clock? Many market traders/analysts want to time the market, yet they are fixated on price. Expand your horizons beyond the one dimension of price. No matter how confident you are with a price pattern it may not work if it's the wrong time. Farmers know what time to plant their crops, you need to know when, not just where, to place your trades. |
Independent investment advisor, trader and writer. He has written articles for Technical Analysis of Stocks & Commodities, Traders.com Advantage,Futuresmag.com and, Finance Magnates. Author of website Four Dimension Trading.
| Website: | www.fourdimensiontrading.com |
| E-mail address: | markrivest@gmail.com |
Click here for more information about our publications!
PRINT THIS ARTICLE

Request Information From Our Sponsors
- StockCharts.com, Inc.
- Candle Patterns
- Candlestick Charting Explained
- Intermarket Technical Analysis
- John Murphy on Chart Analysis
- John Murphy's Chart Pattern Recognition
- John Murphy's Market Message
- MurphyExplainsMarketAnalysis-Intermarket Analysis
- MurphyExplainsMarketAnalysis-Visual Analysis
- StockCharts.com
- Technical Analysis of the Financial Markets
- The Visual Investor
- VectorVest, Inc.
- Executive Premier Workshop
- One-Day Options Course
- OptionsPro
- Retirement Income Workshop
- Sure-Fire Trading Systems (VectorVest, Inc.)
- Trading as a Business Workshop
- VectorVest 7 EOD
- VectorVest 7 RealTime/IntraDay
- VectorVest AutoTester
- VectorVest Educational Services
- VectorVest OnLine
- VectorVest Options Analyzer
- VectorVest ProGraphics v6.0
- VectorVest ProTrader 7
- VectorVest RealTime Derby Tool
- VectorVest Simulator
- VectorVest Variator
- VectorVest Watchdog