

HOT TOPICS LIST
- MACD
- Fibonacci
- RSI
- Gann
- ADXR
- Stochastics
- Volume
- Triangles
- Futures
- Cycles
- Volatility
- ZIGZAG
- MESA
- Retracement
- Aroon
INDICATORS LIST
LIST OF TOPICS
PRINT THIS ARTICLE
by Mark Rivest
See why the US stock market could be near a significant turning point.
Position: N/A
Mark Rivest
Independent investment advisor, trader and writer. He has written articles for Technical Analysis of Stocks & Commodities, Traders.com Advantage,Futuresmag.com and, Finance Magnates. Author of website Four Dimension Trading.
PRINT THIS ARTICLE
ELLIOTT WAVE
The Final Pieces Of A Ten Year Puzzle?
08/15/19 04:14:59 PMby Mark Rivest
See why the US stock market could be near a significant turning point.
Position: N/A
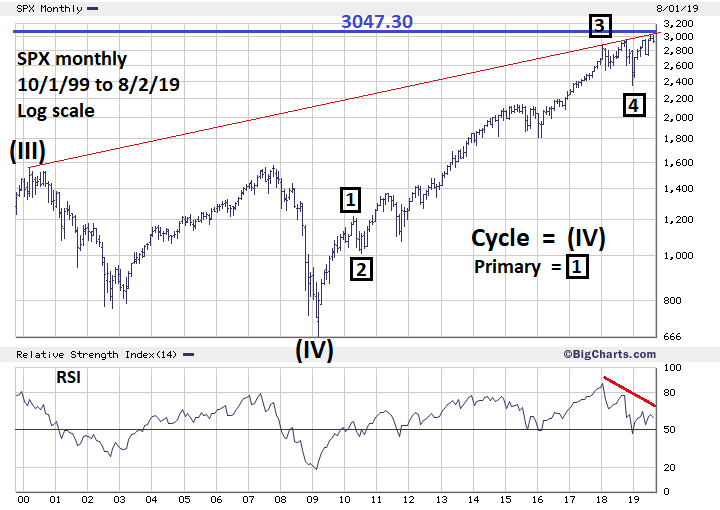
| The core of the Elliott Wave Theory states that progress is made in a five-step pattern which when complete is just one wave of a larger five-step pattern. In the stock market this progression could grow from a one-minute bar chart to a multi-decade chart. Evidence is mounting that the US stock market could be in the last weeks of a bull market that began in March of 2009. One of the oldest, simplest and reliable methods to find support/resistance in markets and stocks is a trend line. Please see the monthly S&P 500 (SPX) chart illustrated in Figure 1. This is an update to the chart featured in my article "The US Long Wave Revisited" published in Technical Analysis of Stocks & Commodities 2019 Bonus issue. The trend line connecting the SPX March 2000 and January 2018 peaks forecasted resistance at the September 2018 high which was the prelude to a three-month 20% decline. When the SPX reached an all-time high on July 26, 2019 at 3028, it was in the area of the nineteen-year rising trend line. Could this event be signaling a major top has been reached? Perhaps, but there's another factor that suggests the SPX could have room to move above 3028. My February 1, 2018 article "How High is Up?" noted a long-term Fibonacci extension that targeted SPX 3047. The resistance level is derived from the length of the SPX 2007 to 2009 bear market of 909.30 points multiplied by the Fibonacci ratio of 2.618, which yields 2380.50 added to the SPX March 2009 bottom of 666.80 targets 3047.30. There's always leeway around a Fibonacci resistance/support point which can vary depending how far in price and time a market has traveled from the original coordinates. In this situation the SPX has traveled more than ten years and more than quadrupled in value. The SPX has reached 3028, only nineteen points from the target, acceptable leeway considering how far the SPX has traveled. However, the SPX short-term Elliott wave count hints there could be one more rally that could break above 3028. |
|
| Figure 1. When the SPX reached an all-time high on July 26, 2019 at 3028 it was in the area of the nineteen-year rising trend line. |
| Graphic provided by: BigCharts.com. |
| |
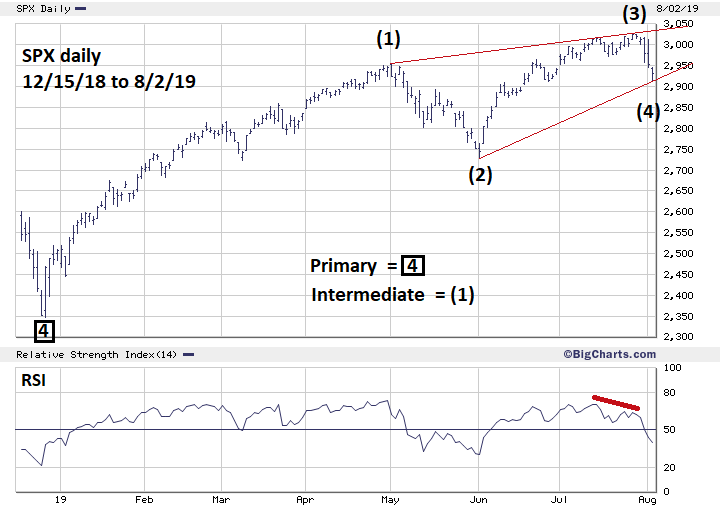
| S&P 500 Since 2018 The SPX rally from the late December 2018 bottom appears to be forming an Elliott wave Ending Diagonal Triangle (EDT). These structures appear in the fifth wave position and in "C" waves. EDTs are found at termination points of larger patterns, indicating exhaustion of the larger movement. Please see the daily SPX chart illustrated in Figure 2. EDTs take a wedge shape and wave "four" almost always overlaps into the territory of wave "one", which in this case the supposed wave (4) is overlapping wave (1). It's possible wave (4) could be complete at the August 2 SPX low 2914.10. A .382 retrace of the supposed wave (3) targets 2913.70. There's chart support at the minor bottom made at 2913.00 on June 26 . Additionally, wave (4) equals 50% of the supposed wave (2) at 2915.30. This tight cluster is formidable support. If the SPX August 2 bottom at 2914.10 does not hold the supposed wave EDT (4) would remain valid at any bottom holding above approximately SPX 2800. At that level the supposed wave (4) would equal the supposed wave (2). At about 2800 the EDT would no longer have a wedge shape, putting the pattern very much in doubt. |
|
| Figure 2. The SPX rally from the late December 2018 bottom appears to be forming an Elliott wave Ending Diagonal Triangle (EDT). |
| Graphic provided by: BigCharts.com. |
| |
| Time Cycles Seasonal peaks for the US stock market are late April to early May and late August to early September. All three main US stock indices have exceeded their early May 2019 highs leaving the door open for a rally into at least late August 2019. The long-term SPX trend line from March 2000 is projected to be just below very important Fibonacci resistance at 3047 in late August. Similarly, the short-term trend line on the daily SPX chart connecting the supposed wave (1) top and the supposed wave (3) peak is also projected to be near SPX 3047 in late August. If the SPX can exceed its current high at 3028 anytime in August 2019 it will be up against long- and short-term trend lines near a major Fibonacci point at a time when US stocks seasonally top out. A significant turn to the downside could be in the making. Further Reading: Rivest, Mark (2019) "The US Long Wave Revisited" Technical Analysis of Stocks & Commodities, Volume 37: Bonus Issue. Frost A.J and Robert Prechter (1985) "Elliott Wave Principle", New Classics Library. |
Independent investment advisor, trader and writer. He has written articles for Technical Analysis of Stocks & Commodities, Traders.com Advantage,Futuresmag.com and, Finance Magnates. Author of website Four Dimension Trading.
| Website: | www.fourdimensiontrading.com |
| E-mail address: | markrivest@gmail.com |
Click here for more information about our publications!
PRINT THIS ARTICLE

Request Information From Our Sponsors
- StockCharts.com, Inc.
- Candle Patterns
- Candlestick Charting Explained
- Intermarket Technical Analysis
- John Murphy on Chart Analysis
- John Murphy's Chart Pattern Recognition
- John Murphy's Market Message
- MurphyExplainsMarketAnalysis-Intermarket Analysis
- MurphyExplainsMarketAnalysis-Visual Analysis
- StockCharts.com
- Technical Analysis of the Financial Markets
- The Visual Investor
- VectorVest, Inc.
- Executive Premier Workshop
- One-Day Options Course
- OptionsPro
- Retirement Income Workshop
- Sure-Fire Trading Systems (VectorVest, Inc.)
- Trading as a Business Workshop
- VectorVest 7 EOD
- VectorVest 7 RealTime/IntraDay
- VectorVest AutoTester
- VectorVest Educational Services
- VectorVest OnLine
- VectorVest Options Analyzer
- VectorVest ProGraphics v6.0
- VectorVest ProTrader 7
- VectorVest RealTime Derby Tool
- VectorVest Simulator
- VectorVest Variator
- VectorVest Watchdog