

HOT TOPICS LIST
- MACD
- Fibonacci
- RSI
- Gann
- ADXR
- Stochastics
- Volume
- Triangles
- Futures
- Cycles
- Volatility
- ZIGZAG
- MESA
- Retracement
- Aroon
INDICATORS LIST
LIST OF TOPICS
PRINT THIS ARTICLE
by Mark Rivest
Simple methods to measure sentiment of the US stock market. Every market has four dimensions: Price, Time, Momentum, and Sentiment. The Sentiment dimension delves into the realm of investor/trader psychology by discovering bullish and bearish extremes. Important market turns can occur if participants overwhelming believe a market will continue in its current direction. When this condition happens it could be time to trade contrary to the prevailing trend. There are easy ways to find US stock market sentiment extremes that could improve your trading.
Position: N/A
Mark Rivest
Independent investment advisor, trader and writer. He has written articles for Technical Analysis of Stocks & Commodities, Traders.com Advantage,Futuresmag.com and, Finance Magnates. Author of website Four Dimension Trading.
PRINT THIS ARTICLE
SENTIMENT INDEX
Stock Market Signals From The Sentiment Dimension
08/30/19 12:33:35 PMby Mark Rivest
Simple methods to measure sentiment of the US stock market. Every market has four dimensions: Price, Time, Momentum, and Sentiment. The Sentiment dimension delves into the realm of investor/trader psychology by discovering bullish and bearish extremes. Important market turns can occur if participants overwhelming believe a market will continue in its current direction. When this condition happens it could be time to trade contrary to the prevailing trend. There are easy ways to find US stock market sentiment extremes that could improve your trading.
Position: N/A
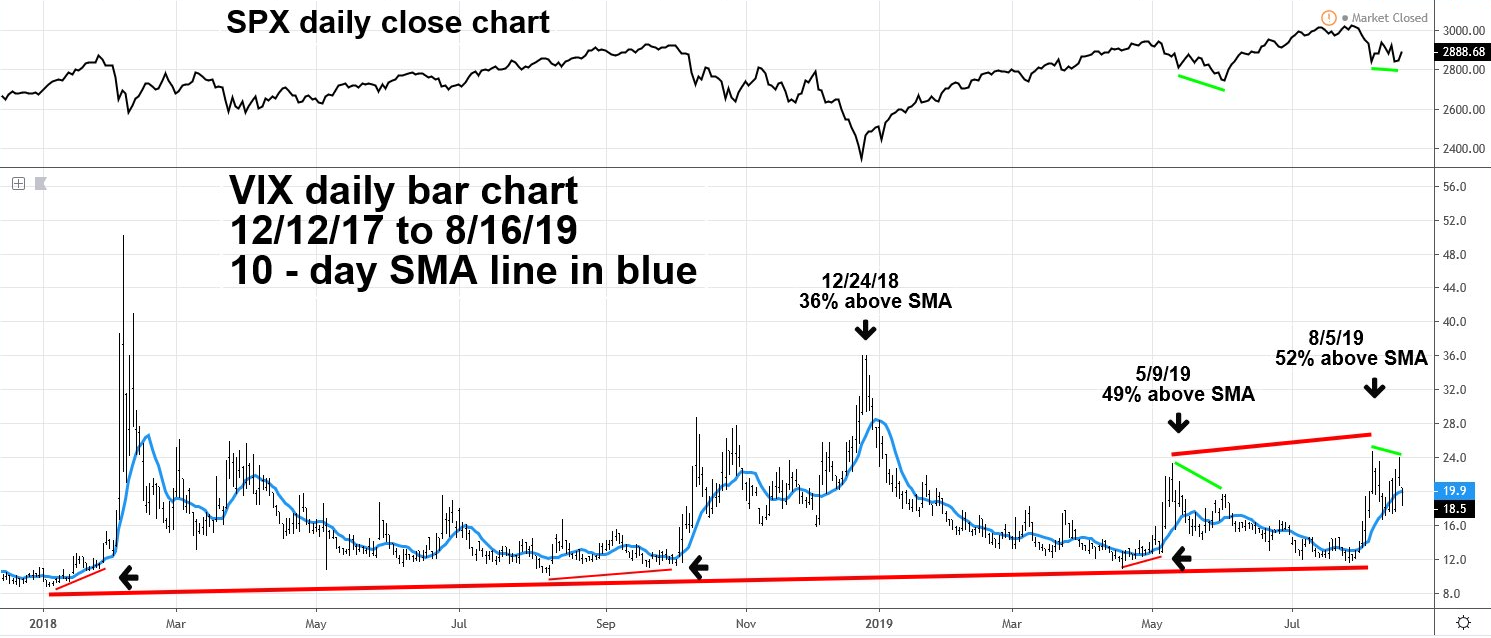
| VIX Index The CBOE Volatility Index, known by its ticker symbol VIX, measures the stock market's expectation of volatility implied by S&P 500 index options. It is calculated and disseminated on a real-time basis by the Chicago Board Options Exchange and is referred to as the fear index. When the VIX spikes up it implies a great amount of fear, or bearishness, and the potential for a stock market bottom. Please see the daily VIX and S&P 500 (SPX) chart illustrated in Figure 1. The Psychological Market Indicator section of "Investor's Business Daily" gauges the VIX with a 10-day moving average; a move of 20% or more above this average indicates a potential stock market bottom could be forming. The VIX chart illustrated in Figure 1 uses a 10-day Simple Moving Average (SMA). Exceeding 20% above the line of course does not mean it can't rise higher, in each of the three examples illustrated the VIX went more than 30% above the line. Exceeding 20% can put you on alert that if a stock market bottom is not already in place, a bottom could be made within one to three trading days. What about using the VIX to find stock market tops? Does a very low reading mean a top could be in place? The answer is a definite no. Fear in the stock market is much more intense at bottoms than dispersed complacency at market peaks, which is why bottoms are usually made in just one day as opposed to tops that could spread out for several weeks. While you probably won't be able to discover the specific day of a market peak, you can at least see when a top could be forming. Note that in January 2018, August to mid-September 2018, and April 2019 the VIX had a series of rising bottoms — an indication that at least an intermediate stock market top could be near. Also note the longer-term series of rising VIX bottoms from January 2018 to July 2019. Perhaps this is a clue of major top approaching or already in place. Occasionally the VIX will have divergences at market turns; note that on June 3, 2019 the VIX had a lower reading than on May 9, 2019 at a higher SPX bottom. This indicates that fear was dissipating on June 3. The same phenomenon may have happened on the August 15 SPX closing which was slightly lower than the August 5 close. There's one other divergence that is potentially bearish for the SPX. Note that as of August 16 the SPX decline is smaller than the May to June drop but the VIX has a higher reading. This could mean control has shifted to the bears implying the SPX may soon break below the August 5 and 15 bottoms. |
|
| Figure 1. When the VIX spikes up it implies a great amount of fear or bearishness and the potential for a stock market bottom. |
| Graphic provided by: tradingview.com. |
| |
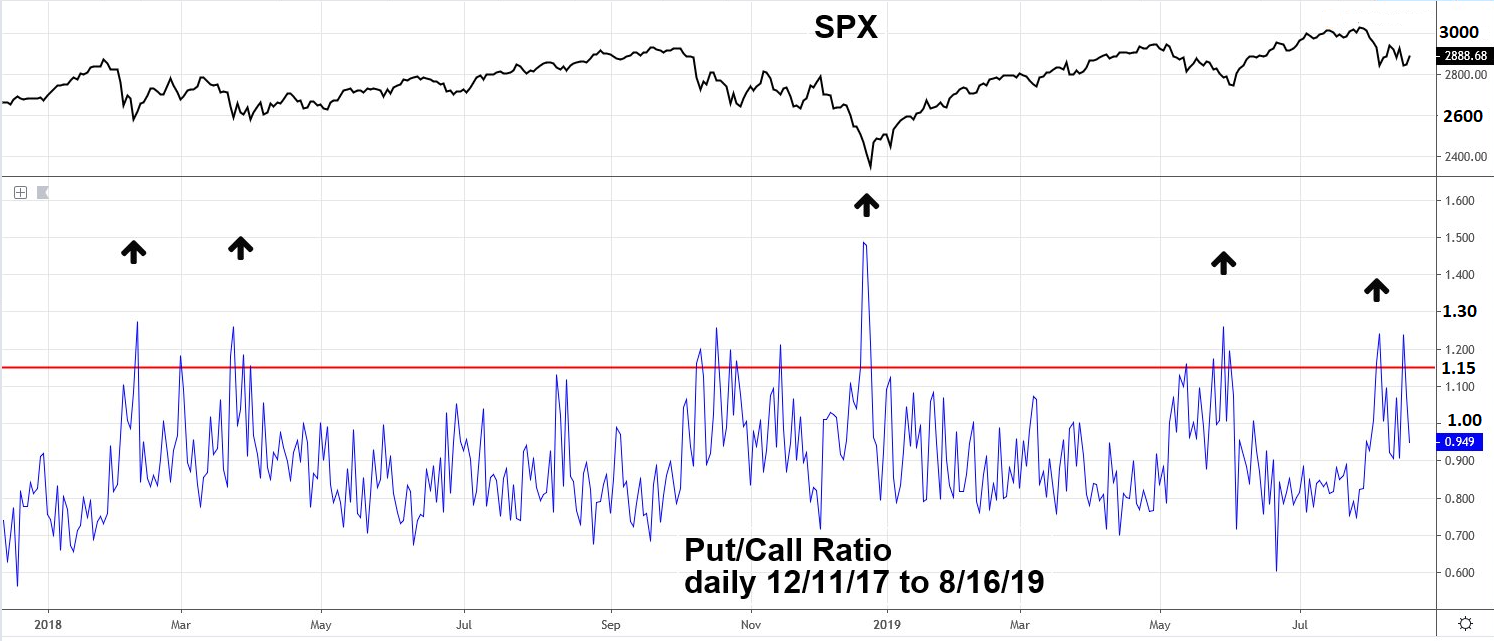
| Put/Call Ratio Another contrarian sentiment indicator that helps determine major and short-term market bottoms is the CBOE Put/Call Volume Ratio, which compares the total number of puts traded each day with the total number of calls. Please see the daily Put/Call ratio chart illustrated in Figure 2. Again "Investor's Business Daily" has a very simple method to determine possible stock market bottoms. Anytime the P/C ratio exceeds 1.15 a potential bottom could be forming. Like the VIX, the P/C ratio could continue moving higher within the next one to three trading days after the initial break above 1.15. Caution, sometime the P/C ratio can hit a peak and the stock market could continue lower. This happened on December 21, 2018 with a P/C ratio intraday high of 1.80, the SPX continued lower and finally bottomed on the 26th with the P/C ratio below 1.00. This is another example of a sentiment divergence, in this case bullish for stocks. |
|
| Figure 2. Anytime the P/C ratio exceeds 1.15 a potential bottom could be forming. |
| Graphic provided by: tradingview.com. |
| |
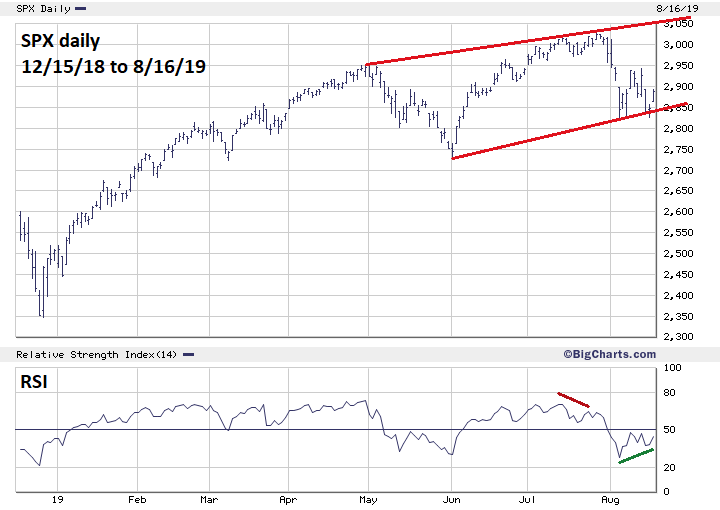
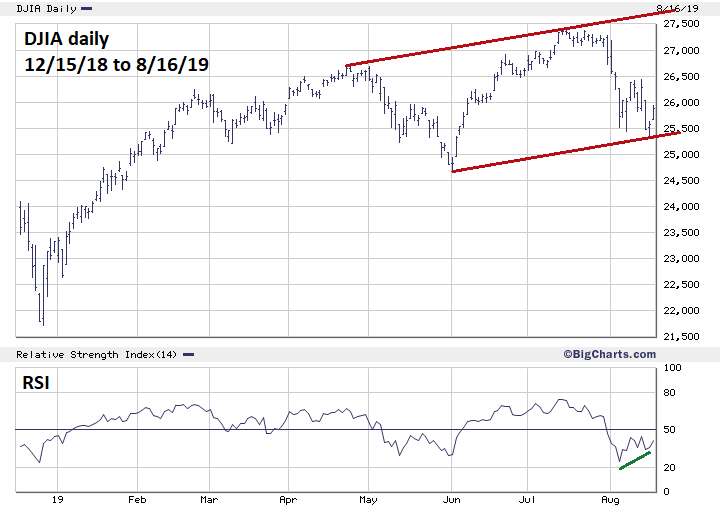
| S&P 500 and Dow Jones Industrial Average My August 15 article "The Final Pieces of a Ten-Year Puzzle?" noted the SPX could be forming an Elliott wave Ending Diagonal Triangle (EDT). At the time of writing it appeared that the SPX minor bottom at 2914 may have been the termination point of the supposed wave (4). Also noted that if the 2914 bottom was broken the EDT would remain valid at any level above 2800 which is where the EDT would no longer have a wedge shape, putting the pattern much in doubt. Please see the daily SPX chart illustrated in Figure 3. The SPX still is within a rising wedge — barely. Now please see the daily Dow Jones Industrial Average (DJIA) chart illustrated in Figure 4. The DJIA is within a perfect parallel trend channel. While this is not an Elliott wave rule violation for an EDT, with this shape it's a very low probability the DJIA is forming an EDT. What about an EDT that has diverging trend lines creating an expanding wedge rather than a contracting wedge? Again, a very low probability. The SPX and DJIA are probably forming something other than an EDT. As of mid-August 2019 there are several alternate wave counts none of which currently has a high probability. Near-term, the direction is probably up as both the DJIA and SPX had bullish RSI divergences on August 15 which confirm the bullish sentiment readings. |
|
| Figure 3. The SPX still is within a rising wedge — barely. |
| Graphic provided by: BigCharts.com. |
| |
| Levels To Watch If stocks continue to rally off the low made on August 15 the SPX has a good chance to reach major Fibonacci and long-term trend line resistance in the 3050 area. Please see Figure 1 in my August 15 article. This could happen by late August or early September, right on the cusp of a seasonal bear zone. If the SPX declines after hitting this price/time zone it could be the best shorting opportunity since September 2018. Bears need to be cautious if the SPX rallies beyond 3050, there's always leeway around Fibonacci and trend line targets. If SPX breaks above 3080 it could be headed to the next major Fibonacci resistance zone around 3300, noted in my June 28 article, "Setting Trading Targets". If within the next few weeks the SPX breaks below the August 5 bottom at 2822, it could open the door for a move down to the next support at 2728. No forecasting method is perfect because the mass mind of a market can change direction just as an individual can change direction. Don't get married to a forecast. Your ability to change with the markets could be the most important factor in determining your success as a trader. Further Reading: Neill B. Humphrey (1985) "The Art of Contrary Thinking" The Caxton Printers. Frost A.J and Robert Prechter (1985) "Elliott Wave Principle", New Classics Library. |
|
| Figure 4. The DJIA is within a perfect parallel trend channel. |
| Graphic provided by: BigCharts.com. |
| |
Independent investment advisor, trader and writer. He has written articles for Technical Analysis of Stocks & Commodities, Traders.com Advantage,Futuresmag.com and, Finance Magnates. Author of website Four Dimension Trading.
| Website: | www.fourdimensiontrading.com |
| E-mail address: | markrivest@gmail.com |
Click here for more information about our publications!
PRINT THIS ARTICLE

Request Information From Our Sponsors
- VectorVest, Inc.
- Executive Premier Workshop
- One-Day Options Course
- OptionsPro
- Retirement Income Workshop
- Sure-Fire Trading Systems (VectorVest, Inc.)
- Trading as a Business Workshop
- VectorVest 7 EOD
- VectorVest 7 RealTime/IntraDay
- VectorVest AutoTester
- VectorVest Educational Services
- VectorVest OnLine
- VectorVest Options Analyzer
- VectorVest ProGraphics v6.0
- VectorVest ProTrader 7
- VectorVest RealTime Derby Tool
- VectorVest Simulator
- VectorVest Variator
- VectorVest Watchdog
- StockCharts.com, Inc.
- Candle Patterns
- Candlestick Charting Explained
- Intermarket Technical Analysis
- John Murphy on Chart Analysis
- John Murphy's Chart Pattern Recognition
- John Murphy's Market Message
- MurphyExplainsMarketAnalysis-Intermarket Analysis
- MurphyExplainsMarketAnalysis-Visual Analysis
- StockCharts.com
- Technical Analysis of the Financial Markets
- The Visual Investor