HOT TOPICS LIST
- MACD
- Fibonacci
- RSI
- Gann
- ADXR
- Stochastics
- Volume
- Triangles
- Futures
- Cycles
- Volatility
- ZIGZAG
- MESA
- Retracement
- Aroon
INDICATORS LIST
LIST OF TOPICS
PRINT THIS ARTICLE
by Mark Rivest
See why this indicator could be warning of a sharp decline in US stocks.
Position: Sell
Mark Rivest
Independent investment advisor, trader and writer. He has written articles for Technical Analysis of Stocks & Commodities, Traders.com Advantage,Futuresmag.com and, Finance Magnates. Author of website Four Dimension Trading.
PRINT THIS ARTICLE
MOMENTUM
The Bullish Percent Index
10/24/19 04:28:08 PMby Mark Rivest
See why this indicator could be warning of a sharp decline in US stocks.
Position: Sell
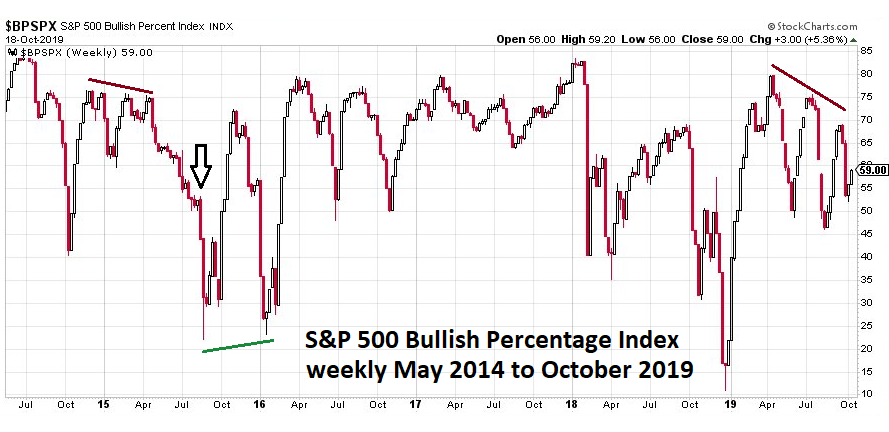
| Many market traders focus almost exclusively on price patterns, sometimes missing what could be happening underneath the surface. Momentum indicators can often discover a market's hidden strengths or weaknesses preparing you for a potential trend change. One momentum indicator, the Bullish Percent Index, for the S&P 500 (SPX) is signaling a possible steep stock market drop. Bullish Percent Index In 2015 A Bullish Percent Index measures the percentage of stocks within a particular group that are on Point & Figure buy signals. Stockcharts.com has Bullish Percent indices for several stock indexes. Two of the prominent stock indices that they list are the S&P 500 Bullish Percent Index ($BPSPX) and the Nasdaq 100 Bullish Percent Index ($BPNDX). $BPSPX usually does not give precise sell signals, it's a multi-month process. On rare occasions $BPSPX can give buy signals. Please see the weekly Bullish Percent Index chart illustrated in Figure 1. The $BPSPX bearish divergences vs. the SPX in 2015 came in three phases. First was the primary top which occurred in July 2014 corresponding to the SPX high. The next phase was a series of declining $BPSPX peaks from late 2014 to mid-2015 which also diverged from the high made in July 2014. The last phase came in late July to early August 2015 with $BPSPX significantly below the prior series of declining peaks. After the final phase, the SPX and the global stock market suffered a mini-crash. The crash bottom in August 2015 set up the first part of a rare bullish divergence with the higher $BPSPX bottom coming in January 2016 with a lower SPX bottom. Also note that a sell signal can occur on just one $BPSPX divergence, this happened in September 2014 and September 2018. |

|
| Figure 1. The $BPSPX bearish divergences vs. the SPX in 2015 came in three phases. |
| Graphic provided by: StockCharts.com. |
| |
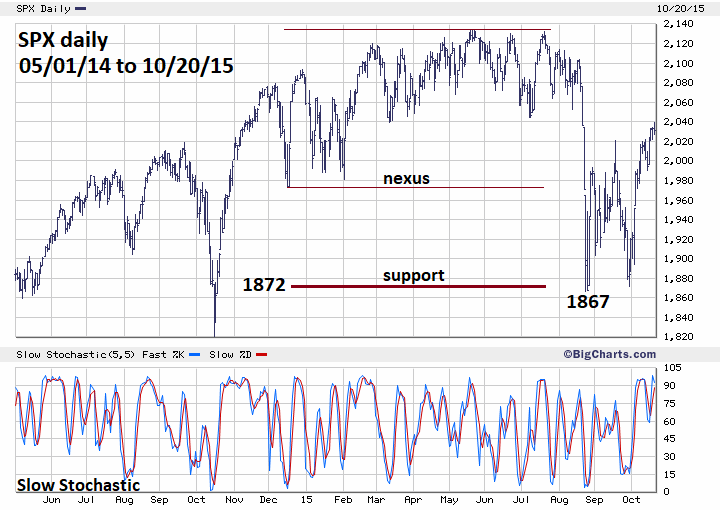
| S&P 500 In 2015 Please see the daily SPX chart illustrated in Figure 2. Traders focusing just on price from early to mid - 2015 could believe that the SPX was building a basing pattern in the low 2100 area and poised for a rally to new highs. Traders that expanded their horizons beyond the dimension of price had a major clue from $BPSPX that down was the most likely direction. Another interesting phenomenon occurred in 2015 — a bearish Fibonacci extension from an important correction bottom. Normally, when correcting upside progress, you would look for a Fibonacci retracement between a significant low and high. From 2014 to 2015 the significant low was made in October 2014 at SPX 1820 and the high at 2134 in May 2015. In this situation an analyst could expect the most bearish retracement to be equality — 100% back to the rallies point of origin at 1820. However, the mini-crash bottom came at 1867, beyond leeway for a bottom at 1820. What happened was a bearish extension off the significant December 2014 correction bottom at SPX 1972 — this marks the nexus between the two rally phases from the October 2014 low to the May 2015 high. There are 162.10 points between the December 2014 correction and the May 2015 high. Multiplying 162.10 times a Fibonacci .618 yields 100.20 SPX points, subtracted from the nexus at 1972.60 targets a bottom at 1872.40. The actual mini-crash bottom was 1867.10. |

|
| Figure 2. Another interesting phenomenon occurred in 2015: a bearish Fibonacci extension from an important correction bottom. |
| Graphic provided by: BigCharts.com. |
| |
| Bullish Percent Index In 2019 Please see the daily Bullish Percent Index illustrated in Figure 3. This is a close-up view showing a primary $BPSPX top made in January 2018 followed by a series of declining peaks in 2019. The reading made on October 18, 2019 is significantly below the series of declining tops made earlier in the year. If the most recent reading high holds, a significant fall in stocks could begin very soon. Also note that in August $BPSPX broke below the level recorded at the SPX June correction bottom. This could be a very early warning of a decline similar to what happened in April 2018. |

|
| Figure 3. The reading made on October 18, 2019 is significantly below the series of declining tops made earlier in the year. |
| Graphic provided by: StockCharts.com. |
| |
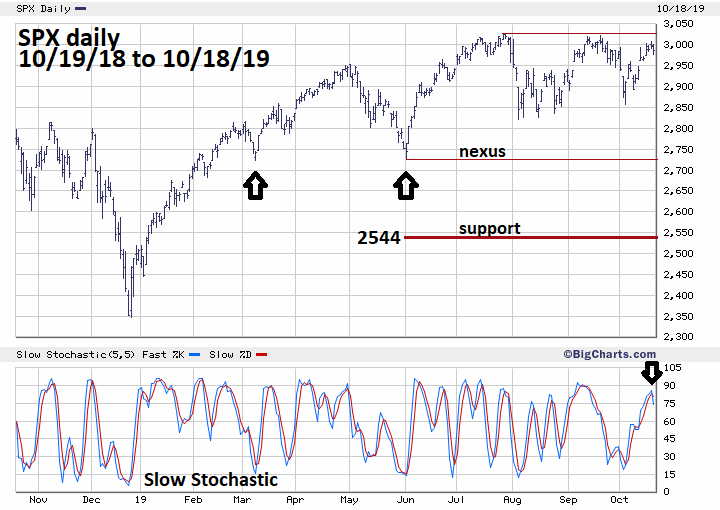
| S&P 500 In 2019 Please see the daily SPX chart illustrated in Figure 4. My September 19, 2019 article "Bearish Months For The Stock Market" speculated that the SPX rally from December 2018 to July 2019 could be the first wave up of an Elliott wave Ending Diagonal Triangle. In this structure, the second wave retracements are usually very deep extending beyond the normally expected .618 retrace — in this case SPX 2607. It's possible the June 2019 correction bottom is a nexus point similar to the SPX December 2014 bottom. In the current situation there are 299.80 SPX points between the June bottom and the July high at 3028. 299.80 multiplied by .618 yields 184.90 which when subtracted from the June low of 2728.80 targets 2543.90 as a potential bottom. Also, note a Slow Stochastic bear cross within the overbought zone recorded on October 18, 2019. |

|
| Figure 4. Note a Slow Stochastic bear cross within the overbought zone recorded on October 18, 2019. |
| Graphic provided by: BigCharts.com. |
| |
| Conclusion US stocks are seasonally bearish from September until early November. If the $BPSPX bearish signals and the recent Slow Stochastic sell signal are correct the SPX has only about three weeks to reach the bullseye target bottom at 2544. If you don't think this is enough time, note that in the 2015 mini-crash the bulk of the decline (10%) happened in only three trading days. If the $BPSPX continues to rise after its October 18 reading it could significantly reduce the chances of a sharp drop. There's an old saying "Don't judge a book by its cover" — In the markets the "cover" is price. Look beyond the dimension of Price, expand your horizon and explore the other market dimensions of Momentum, Time and Sentiment. Further Reading: Frost A.J and Robert Prechter (1985) "Elliott Wave Principle", New Classics Library. |
Independent investment advisor, trader and writer. He has written articles for Technical Analysis of Stocks & Commodities, Traders.com Advantage,Futuresmag.com and, Finance Magnates. Author of website Four Dimension Trading.
| Website: | www.fourdimensiontrading.com |
| E-mail address: | markrivest@gmail.com |
Click here for more information about our publications!
Comments
Date: 11/16/19Rank: 4Comment:

Request Information From Our Sponsors
- StockCharts.com, Inc.
- Candle Patterns
- Candlestick Charting Explained
- Intermarket Technical Analysis
- John Murphy on Chart Analysis
- John Murphy's Chart Pattern Recognition
- John Murphy's Market Message
- MurphyExplainsMarketAnalysis-Intermarket Analysis
- MurphyExplainsMarketAnalysis-Visual Analysis
- StockCharts.com
- Technical Analysis of the Financial Markets
- The Visual Investor
- VectorVest, Inc.
- Executive Premier Workshop
- One-Day Options Course
- OptionsPro
- Retirement Income Workshop
- Sure-Fire Trading Systems (VectorVest, Inc.)
- Trading as a Business Workshop
- VectorVest 7 EOD
- VectorVest 7 RealTime/IntraDay
- VectorVest AutoTester
- VectorVest Educational Services
- VectorVest OnLine
- VectorVest Options Analyzer
- VectorVest ProGraphics v6.0
- VectorVest ProTrader 7
- VectorVest RealTime Derby Tool
- VectorVest Simulator
- VectorVest Variator
- VectorVest Watchdog
