

HOT TOPICS LIST
- MACD
- Fibonacci
- RSI
- Gann
- ADXR
- Stochastics
- Volume
- Triangles
- Futures
- Cycles
- Volatility
- ZIGZAG
- MESA
- Retracement
- Aroon
INDICATORS LIST
LIST OF TOPICS
PRINT THIS ARTICLE
by Mark Rivest
See why US stock could be in a powerful multi-month rally.
Position: N/A
Mark Rivest
Independent investment advisor, trader and writer. He has written articles for Technical Analysis of Stocks & Commodities, Traders.com Advantage,Futuresmag.com and, Finance Magnates. Author of website Four Dimension Trading.
PRINT THIS ARTICLE
ELLIOTT WAVE
Stock Market Super Bullish Scenario
12/12/19 04:42:18 PMby Mark Rivest
See why US stock could be in a powerful multi-month rally.
Position: N/A
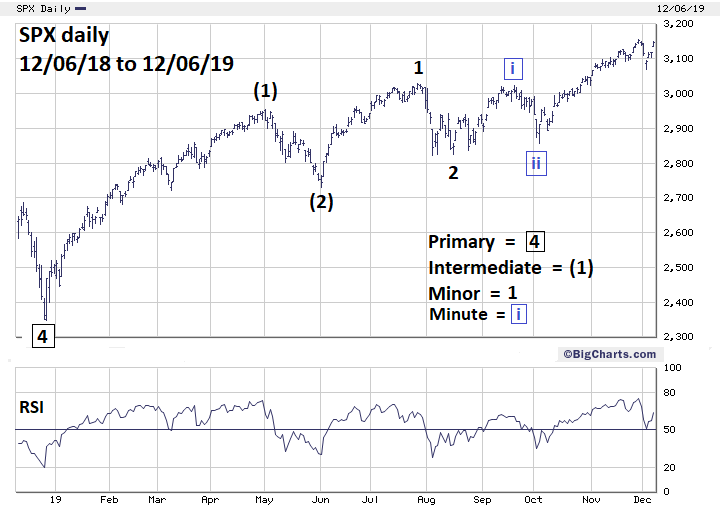
| Elliott wave analysis is a matter of interpreting various paths a market could take. No matter how clear a wave count — nothing is set in stone. Elliott wave patterns represent the progress of the mass mind, that greater mind can and will change direction just like an individual. Objectivity and knowledge of the various alternate Elliott wave counts are the key characteristics analysts need. In late 2019 the US stock market represented by the S&P 500 (SPX) is open to take several paths. This article explores the most bullish possibility. S&P 500 - Daily Elliott wave patterns are in the realm of the Price dimension. The best way to determine any market's path is to use evidence from the other three market dimensions; Time, Momentum and Sentiment. In December 2019, evidence from the Time dimension is hinting US stocks could be just in the early phase of a powerful rally. September to October is a notoriously bearish time for stocks. From late August to early October 2019 the SPX resulted in only a sideways move. The SPX bottomed in early October and rallied the entire month in what's frequently the most bearish month of the year. Seasonal patterns are bullish from November to at least late April. Momentum evidence, primarily from the SPX Bullish Percentage Index indicates the rally could continue. As noted in my November 14 article "Messages From The Transportation Stocks - Part Two" the index had erased a bearish divergence. This index usually requires several bearish divergences over a period of several weeks, or even months, before a significant SPX peak is in place. My December 5 article "Setting Trading Targets - Part Two" noted the SPX two alternate wave counts; the first illustrated has the SPX currently in the third wave of a rising Ending Diagonal Triangle (EDT). The flaw with this count is that the supposed second wave is very shallow for an EDT which normally has a wave "2" retracement of greater than 61% of the preceding wave "1". The other alternative count has the SPX currently completing the first wave of an EDT. The main flaw with this count is that it implies a decline greater than 61% of the rally that began in late 2018 could be coming in just a few weeks. Bullish evidence from the Time and Momentum dimensions argue against this scenario. Please see the daily SPX chart illustrated in Figure 1. This third alternative is what's referred to as a series of ones and twos, the prelude to a very strong steady and relentless third of a third — the heart of a five-wave impulse pattern. This movement when it's to the upside doesn't have giant bursts. On a daily scale each up day is moderate, the declines are short and shallow; this is what's happened in US stocks from October 3rd to early December. |
|
| Figure 1. Seasonal patterns are bullish from November to at least late April. |
| Graphic provided by: BigCharts.com. |
| |
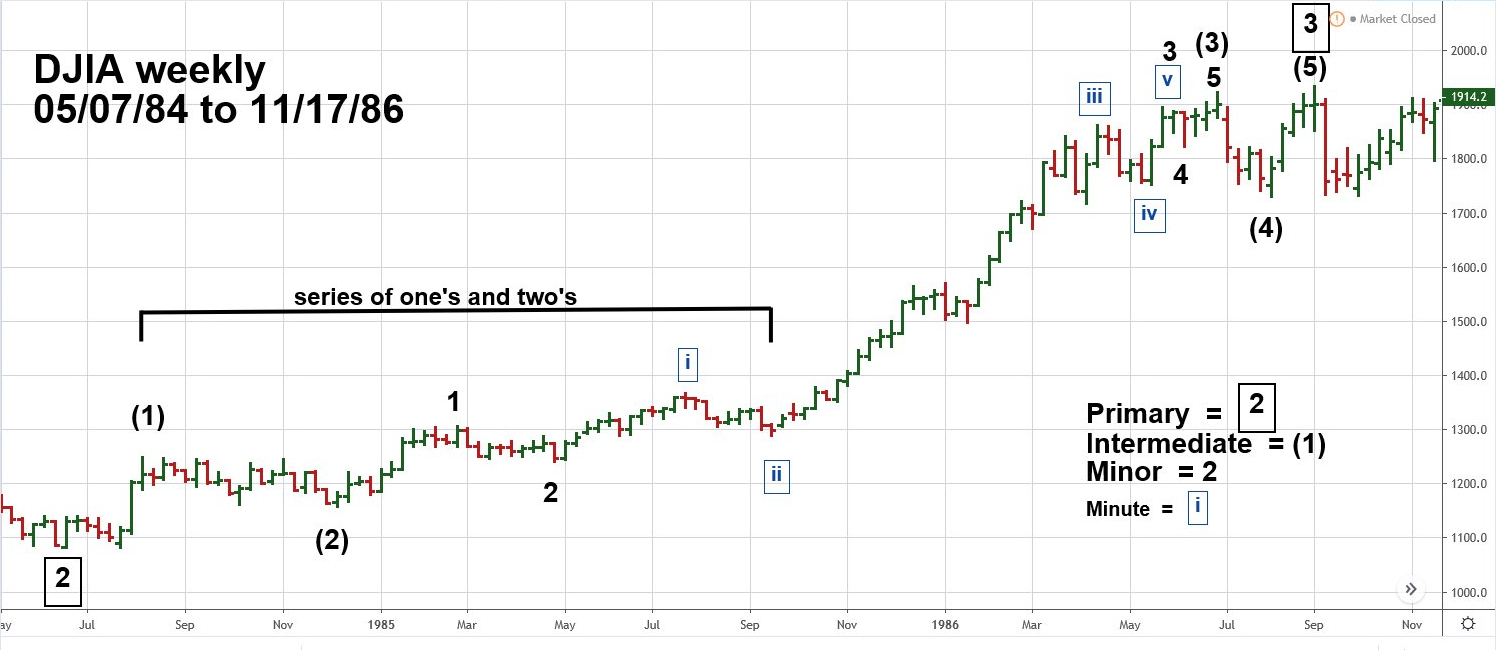
| Historical Perspective Please see the Weekly DJIA chart illustrated in Figure 2. This is a classic example of what happens after a series of ones and twos. The subsequent rally which begins at the bottom of Minute wave "ii" boxed and topped at Minute wave "iii" boxed is the third of a third wave. Also note the time period, September 1985 to April 1986. The DJIA rallied right through the usually bearish month of October just as in 2019. The DJIA Minute wave "iii" rally from 1985 to 1986 was greater than 40%. |
|
| Figure 2. The DJIA Minute wave "iii" rally from 1985 to 1986 was greater than 40%. |
| Graphic provided by: tradingview.com. |
| |
| Projecting Into 2020 If the SPX 2019 series of ones and twos count is correct a rally of 40% from Minute wave "ii" boxed made on October 3 projects the SPX could be at 4000 sometime in April 2020. A break below the October 3 bottom anytime in the next few weeks would eliminate this super bullish forecast. Even a move of more than 5% off the recent high made at 3154 could be suspicious — it would be out of character to what's been happening since October 3. 2019 has been the year of hell for US stock market bears and the year of heaven for the bulls. If the main US stock indices continue to have only shallow declines, heaven could continue until at least April 2020. Further Reading: Frost A.J and Robert Prechter (1985) "Elliott Wave Principle", New Classics Library. |
Independent investment advisor, trader and writer. He has written articles for Technical Analysis of Stocks & Commodities, Traders.com Advantage,Futuresmag.com and, Finance Magnates. Author of website Four Dimension Trading.
| Website: | www.fourdimensiontrading.com |
| E-mail address: | markrivest@gmail.com |
Click here for more information about our publications!
Comments

Request Information From Our Sponsors
- StockCharts.com, Inc.
- Candle Patterns
- Candlestick Charting Explained
- Intermarket Technical Analysis
- John Murphy on Chart Analysis
- John Murphy's Chart Pattern Recognition
- John Murphy's Market Message
- MurphyExplainsMarketAnalysis-Intermarket Analysis
- MurphyExplainsMarketAnalysis-Visual Analysis
- StockCharts.com
- Technical Analysis of the Financial Markets
- The Visual Investor
- VectorVest, Inc.
- Executive Premier Workshop
- One-Day Options Course
- OptionsPro
- Retirement Income Workshop
- Sure-Fire Trading Systems (VectorVest, Inc.)
- Trading as a Business Workshop
- VectorVest 7 EOD
- VectorVest 7 RealTime/IntraDay
- VectorVest AutoTester
- VectorVest Educational Services
- VectorVest OnLine
- VectorVest Options Analyzer
- VectorVest ProGraphics v6.0
- VectorVest ProTrader 7
- VectorVest RealTime Derby Tool
- VectorVest Simulator
- VectorVest Variator
- VectorVest Watchdog