

HOT TOPICS LIST
- MACD
- Fibonacci
- RSI
- Gann
- ADXR
- Stochastics
- Volume
- Triangles
- Futures
- Cycles
- Volatility
- ZIGZAG
- MESA
- Retracement
- Aroon
INDICATORS LIST
LIST OF TOPICS
PRINT THIS ARTICLE
by Mark Rivest
Techniques to track bull and bear markets.
Position: N/A
Mark Rivest
Independent investment advisor, trader and writer. He has written articles for Technical Analysis of Stocks & Commodities, Traders.com Advantage,Futuresmag.com and, Finance Magnates. Author of website Four Dimension Trading.
PRINT THIS ARTICLE
SEASONAL TRADING
Trend Confirming Tools
03/22/18 04:38:17 PMby Mark Rivest
Techniques to track bull and bear markets.
Position: N/A
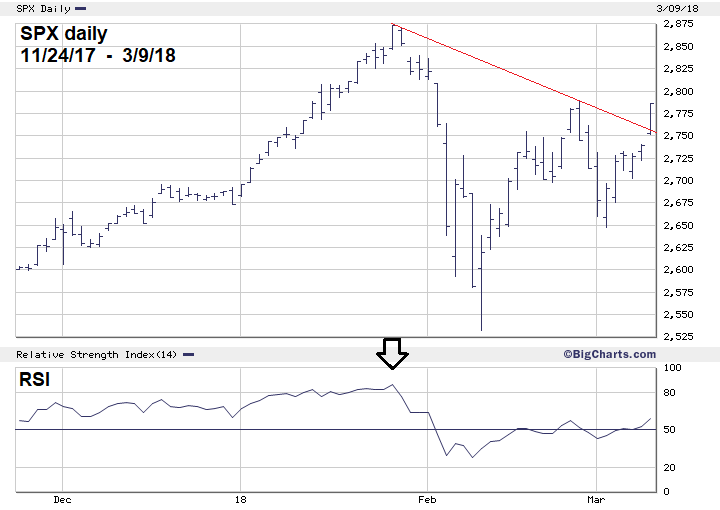
| A main goal of every trader is to recognize the primary trend of any market. To maximize profits, you must move in unison with the market, bull and bear fighting will leave you mauled. In early March 2018 several methodologies indicate the US stock market is likely to continue climbing for several weeks. These methods can be used in any market and any time scale. S&P 500 Daily Looking at the calendar is one of the easiest methods to determine a market's trend. Almost all markets have seasonal trends. "Stock Trader's Almanac" notes that November to April is the most bullish time for the S&P 500 (SPX). As of March 9, the SPX is on track with this seasonal pattern and is up over 8% from the mid November 2017 low. A simple trend line can also give a powerful confirming signal. Please see the daily SPX chart illustrated in Figure 1. The SPX powerful gap up on March 9 also decisively smashed above the declining trend line from the all-time high made in January. Additionally, the SPX on March 9 closed above the Fibonacci .666 retrace of the January-February decline. A move above the February 27 high of 2789.15 could open the door back to the January high. Finally, my January 15 article "RSI - The Super Indicator" noted that that for stocks, RSI readings above 70% and at the highest level since the start of the bull market are bullish. At the SPX high made on January 26 the monthly, weekly and daily RSI were at their highest levels since the bull market began in March 2009. This strongly implies that the SPX could move above the high at 2872.87. If this occurs with bearish RSI divergences, we need to be on alert for what could be a significant top. |
|
| Figure 1. The SPX powerful gap up on March 9 also decisively smashed above the declining trend line from the all�time high made in January. |
| Graphic provided by: BigCharts.com. |
| |
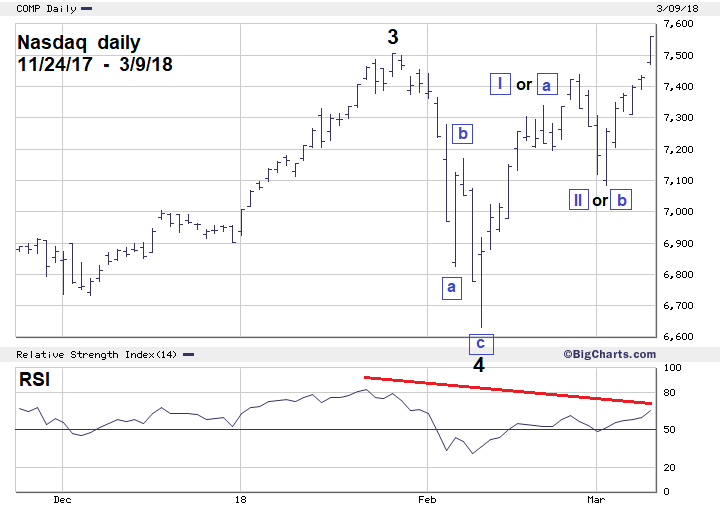
| Nasdaq Composite Daily Please see the Nasdaq daily chart illustrated in Figure 2. The Nasdaq move to a new all-time high on March 9 appears to be additional confirmation of the broad US stock market uptrend. However, this move to a new high is so far unconfirmed by nearly every other stock index either in, or outside, the US. Only the Nasdaq 100 and the SPDR-Technology-ETF (XLK) have confirmed the all-time high. Additionally, the daily Nasdaq also has a bearish RSI divergence with the peak made in January. This is like what happened in July 2015; please see my July 30, 2015 article "A Ludicrous Non-Confirmation". That condition led to the August 2015 mini crash. However, a nearly identical circumstance happened in July 2017; please see my July 14, 2017 article "A Ludicrous Non-Confirmation - The Sequel". Subsequently, the US and global stock markets shrugged off this bearish signal and moved to higher prices. As to what could happen in the next few weeks, Elliott wave analysis could be giving a very important clue. For a significant Nasdaq peak to be in place you would need to have a five-wave subdivision of the rally that began on February 9. So far there appears to be only three-waves, strongly implying higher prices to come soon. We still need to be on the alert that a significant Nasdaq top could be in place, or forming. If US stock prices decline very fast it could be the first sign of something very bearish. A break below the February 9 bottom could trigger a 15% crash. |
|
| Figure 2. We still need to be on the alert that a significant Nasdaq top could be in place or forming. |
| Graphic provided by: BigCharts.com. |
| |
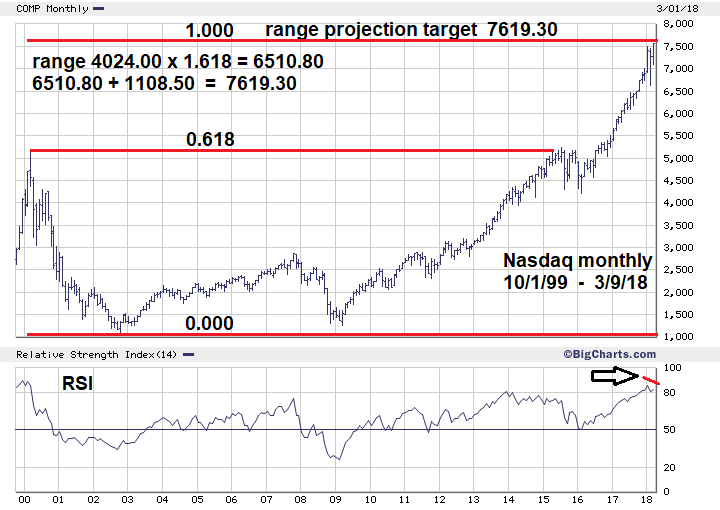
| Nasdaq Monthly Range Projection Please see the Nasdaq monthly range projection chart in Figure 3. Another hint the Nasdaq could be nearing a significant top comes from Fibonacci analysis. The range of the March 2000-October 2002 Nasdaq decline was 4024.00 points multiplied by 1.618 equals 6510.80 points added to the October 2002 bottom at 1108.50 targets Nasdaq 7619.30 as a potential major top. This is the same technique and Fibonacci ratio I used to discover the SPX-May 2015 peak. Please see my June 8, 2015 article "The Golden Section". Also note there is currently a monthly Nasdaq RSI bearish divergence. The target price of 7619.30 is only seven tenths of one percent away from the Nasdaq high of 7560.80 made on March 9. This is close enough to be considered a hit. Elliott wave analysis of the Nasdaq rally from February 9 suggests prices above 7619.30. There could be a higher Fibonacci coordinate that may indicate a significant Nasdaq top. |
|
| Figure 3. Another hint the Nasdaq could be nearing a significant top comes from Fibonacci analysis. |
| Graphic provided by: BigCharts.com. |
| |
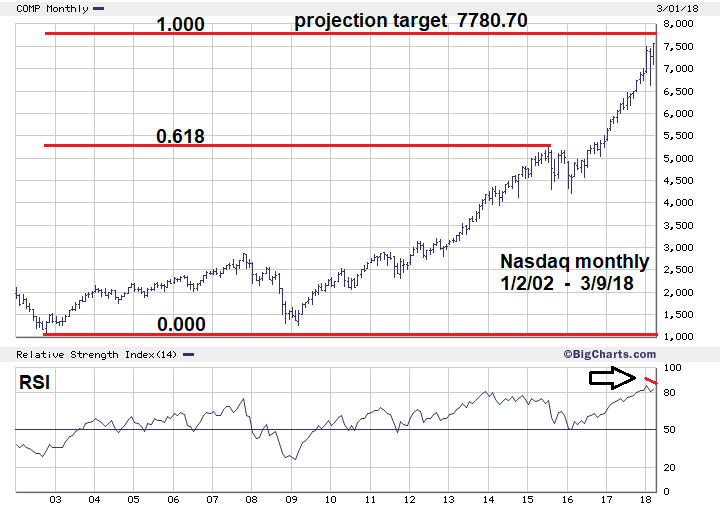
| Nasdaq Alternate Monthly Range Projection Please see the Nasdaq monthly 1/2/02-3/9/18 chart illustrated in Figure 4. Note that on the Figure 3 chart that the Nasdaq-May 2015 top is close to the .618 level. Sometimes Fibonacci projections can be made from intermediate tops or bottoms to discover major turns. Perhaps the May 2015 intermediate peak at 5231.90 is the nexus for the Nasdaq bull market from October 2002. The range from the May 2015 top to the October 2002 bottom is 4123.40 divided by .618 equals 6672.20 Nasdaq points added to the October 2002 bottom at 1108.50 targets Nasdaq 7780.70 as a potential top. This level is 2.9% above the Nasdaq March 9 high and allows enough space for an Elliott five-wave pattern to develop. |
|
| Figure 4. Perhaps the May 2015 intermediate peak at 5231.90 is the nexus for the Nasdaq bull market from October 2002. |
| Graphic provided by: BigCharts.com. |
| |
| Conclusion My March 3 article "Stock Market Rosetta Stone" noted speed was needed to for the bears to regain control. Between February 27 and March 2, the SPX quickly fell 142 points. This decline had no follow through and as of March 9 SPX had retraced nearly the entire decline. The bulls are still in control. Seasonal patterns, breach of the declining trend line and daily RSI hint that in a few weeks the SPX could make a new all-time high. Further Reading: Frost A.J and Robert Prechter (1985) "Elliott Wave Principle", New Classics Library. |
Independent investment advisor, trader and writer. He has written articles for Technical Analysis of Stocks & Commodities, Traders.com Advantage,Futuresmag.com and, Finance Magnates. Author of website Four Dimension Trading.
| Website: | www.fourdimensiontrading.com |
| E-mail address: | markrivest@gmail.com |
Click here for more information about our publications!
PRINT THIS ARTICLE

Request Information From Our Sponsors
- VectorVest, Inc.
- Executive Premier Workshop
- One-Day Options Course
- OptionsPro
- Retirement Income Workshop
- Sure-Fire Trading Systems (VectorVest, Inc.)
- Trading as a Business Workshop
- VectorVest 7 EOD
- VectorVest 7 RealTime/IntraDay
- VectorVest AutoTester
- VectorVest Educational Services
- VectorVest OnLine
- VectorVest Options Analyzer
- VectorVest ProGraphics v6.0
- VectorVest ProTrader 7
- VectorVest RealTime Derby Tool
- VectorVest Simulator
- VectorVest Variator
- VectorVest Watchdog
- StockCharts.com, Inc.
- Candle Patterns
- Candlestick Charting Explained
- Intermarket Technical Analysis
- John Murphy on Chart Analysis
- John Murphy's Chart Pattern Recognition
- John Murphy's Market Message
- MurphyExplainsMarketAnalysis-Intermarket Analysis
- MurphyExplainsMarketAnalysis-Visual Analysis
- StockCharts.com
- Technical Analysis of the Financial Markets
- The Visual Investor