HOT TOPICS LIST
- MACD
- Fibonacci
- RSI
- Gann
- ADXR
- Stochastics
- Volume
- Triangles
- Futures
- Cycles
- Volatility
- ZIGZAG
- MESA
- Retracement
- Aroon
INDICATORS LIST
LIST OF TOPICS
PRINT THIS ARTICLE
by Mark Rivest
Is the Dow Jones Industrial Average move to new highs a sign of weakness for stocks?
Position: Sell
Mark Rivest
Independent investment advisor, trader and writer. He has written articles for Technical Analysis of Stocks & Commodities, Traders.com Advantage,Futuresmag.com and, Finance Magnates. Author of website Four Dimension Trading.
PRINT THIS ARTICLE
MARKET TIMING
A Ludicrous Non-Confirmation - The Sequel
07/14/17 02:59:02 PMby Mark Rivest
Is the Dow Jones Industrial Average move to new highs a sign of weakness for stocks?
Position: Sell
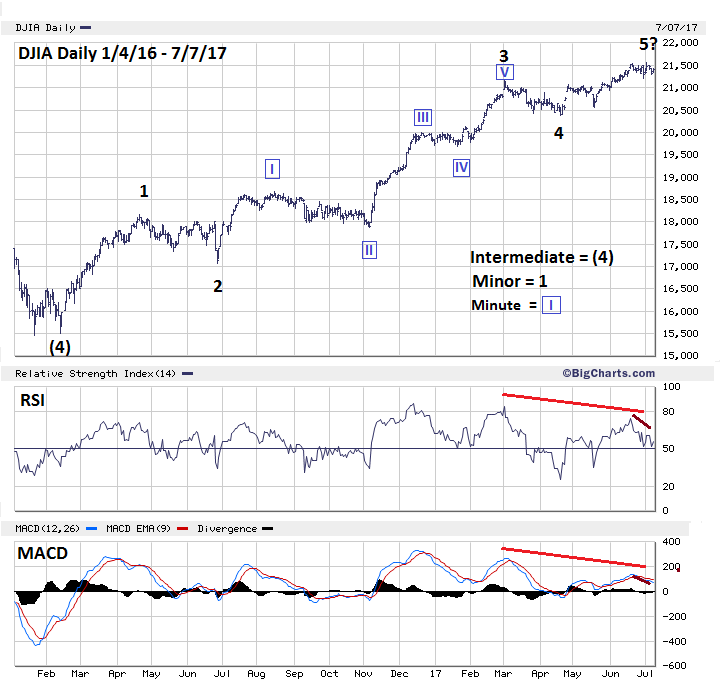
| When a movie is a big hit, many times about two years later the sequel to that movie will be released. Two years ago, the stock market had a big hit. On July 20, 2015, the Nasdaq made an all-time high that was unconfirmed by nearly every other stock index. Please see my July 30, 2015 article "A Ludicrous Non-Confirmation". The result of this non-confirmation was the August 2015 mini-crash — the S&P 500 (SPX) fell 12.4% and the Nasdaq (COMP) fell 17.90%. On July 3, 2017, nearly two years after the COMP ludicrous non-confirmation the Dow Jones Industrial Average (DJIA) made an all-time high that was unconfirmed by nearly every other stock index. A comparison of the 2015 COMP peak with the 2017 DJIA peak reveals clues as to what could happen in the next two months. 2015 Peak vs 2017 Peak The July 2015 COMP all-time high was unconfirmed by the other two main US stock indexes, SPX and DJIA. Also, not confirming were: the Dow Jones Transportation Average (DJTA), S&P 400 mid-cap stocks, and Russell 2000 small-cap stocks. No other major nation's stock indices confirmed the high. The only confirmation came from the Nasdaq 100 and five of the nine SPDR sector funds. The July 3, 2017 DJIA all-time high was unconfirmed by the other two main US stock indexes, SPX and COMP. Also, not confirming were: the Nasdaq 100, S&P 400 mid-cap stocks, and the Russell 2000 small cap stocks. None of the nine SPDR sector funds confirmed the high. At the SPX all-time high on June 19 two of the SPDR sector funds confirmed the high. No other major nation's stock indices confirmed the high. The only confirmation came from the DJTA. Please see the Daily DJIA chart illustrated in Figure 1. The DJIA Elliott wave count from the February 11, 2016 bottom shows a clear five wave rally that is complete, or close to completion. The supposed Minor wave "5" could, in the very near term, make a new high. Arguing against the DJIA making a new high are the daily RSI and MACD, both have significant double bearish divergences at the July 3rd peak. |

|
| Figure 1. Arguing against the DJIA making a new high are the daily RSI and MACD, both have significant double bearish divergences at the July 3 peak. |
| Graphic provided by: BigCharts.com. |
| |
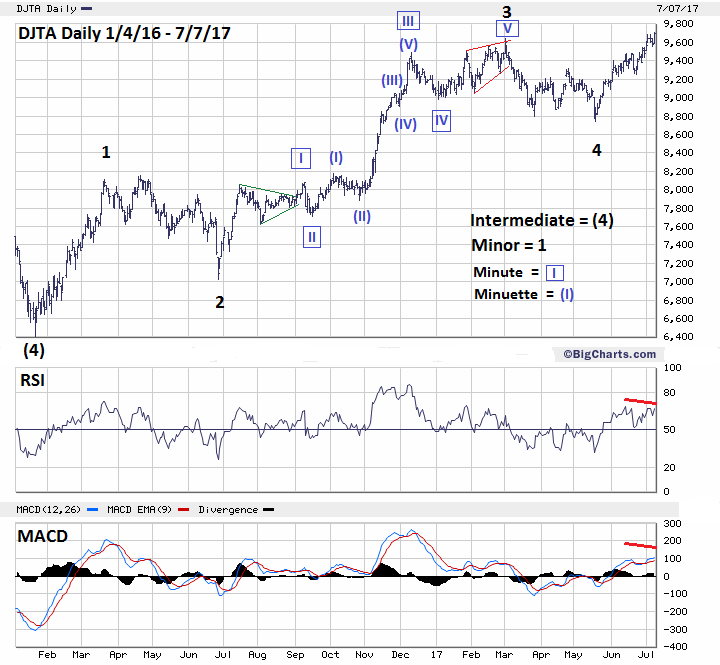
| Dow Jones Transportation Average The Dow Theory is one of the oldest stock market methodologies and provides the foundation to much of modern technical analysis. The Elliott wave theory could not have been discovered by R.N. Elliott without standing on the shoulders of the Dow Theory. A main tenet of Dow Theory are confirmations between the industrial stocks and transportation stocks. This principle was developed when there were only two US stock indices, the Dow Industrials and the Dow Rails — now called Transports. In a rising market if one index failed to confirm a new bull market peak made by the other, it was a signal of a coming bear trend. In a falling market, a non-confirmation signaled an approaching bull market. Since the development of this Dow Theory principle over one hundred years ago, the US stock market has evolved considerably. There are now dozens of stock indices for sectors and sub sectors of the economy. In addition, one hundred years ago transportation costs were a significant factor in determining a company's profitability. Today, for many companies, transportation costs are not a significant factor in profitability. On July 3, 2017, both the DJIA and DJTA made all-time highs, under Dow Theory this confirmation is viewed as very favorable to the stock bull market. This supposed bullish signal must be viewed in the proper context. On July 3, the other two main US stock indices failed to confirm the high. No secondary US stock index confirmed the high. None of the nine SPDR sector funds confirmed the high. The weight of evidences indicates that the supposed Dow Theory bull market confirmation signal is probably false. Please see the Daily DJTA chart illustrated in Figure 2. The DJTA from its early 2016 bottom has a clear five wave pattern that looks nearly complete. The supposed Minor wave "5" appears to need one small decline followed by a new all-time high to complete the pattern. Minor wave "1" = 1745.669 x .618 = 1078.83 + Minor wave "4" bottom at 8744.36 = 9823.19. The DJTA high on July 3rd was 9704.52. If the DJTA can continue to rise a likely topping zone is the 9800-9830 areas. |

|
| Figure 2. The DJTA from its early 2016 bottom has a clear five wave pattern that looks nearly complete. |
| Graphic provided by: BigCharts.com. |
| |
| Summary and Strategy For several months, the momentum for the US and global stock market has been deteriorating to a point where it is now at the ludicrous phase. Currently, there are very few stocks in the US market that are making all-time highs. This is the exact opposite of what would be expected for the rally to continue. My July 7th article "Anatomy of a Stock Market Top" detailed a downward path the SPX could take in the next few months. Because of the subsequent ludicrous non-confirmation a SPX decline into the July-August time zone could be even more bearish than illustrated in the July 7th article. A mini-crash of 12-15% from the SPX high of 2453 could happen sometime in August. Hold short 50% stocks and use 2510 as a stop loss. If conditions are favorable a recommendation to add shorts could come in my next article. The inspiration for the title of my July 30, 2015 article came from the 1987 Mel Brooks movie "Spaceballs" in which the villain's starship is ordered to ludicrous speed. The tagline for the movie was "May the Schwartz be with you". Considering the bearish condition of the stock market it is again appropriate to modify that tagline. "May shorts be with you". Further Reading: Frost A.J and Robert Prechter (1985) "Elliott Wave Principle", New Classics Library. Russell Richard (1958-59-60 - Copyright Barron's) "The Dow Theory Today" Fraser Publishing Company Edition 1981. |
Independent investment advisor, trader and writer. He has written articles for Technical Analysis of Stocks & Commodities, Traders.com Advantage,Futuresmag.com and, Finance Magnates. Author of website Four Dimension Trading.
| Website: | www.fourdimensiontrading.com |
| E-mail address: | markrivest@gmail.com |
Click here for more information about our publications!
Comments

Request Information From Our Sponsors
- StockCharts.com, Inc.
- Candle Patterns
- Candlestick Charting Explained
- Intermarket Technical Analysis
- John Murphy on Chart Analysis
- John Murphy's Chart Pattern Recognition
- John Murphy's Market Message
- MurphyExplainsMarketAnalysis-Intermarket Analysis
- MurphyExplainsMarketAnalysis-Visual Analysis
- StockCharts.com
- Technical Analysis of the Financial Markets
- The Visual Investor
- VectorVest, Inc.
- Executive Premier Workshop
- One-Day Options Course
- OptionsPro
- Retirement Income Workshop
- Sure-Fire Trading Systems (VectorVest, Inc.)
- Trading as a Business Workshop
- VectorVest 7 EOD
- VectorVest 7 RealTime/IntraDay
- VectorVest AutoTester
- VectorVest Educational Services
- VectorVest OnLine
- VectorVest Options Analyzer
- VectorVest ProGraphics v6.0
- VectorVest ProTrader 7
- VectorVest RealTime Derby Tool
- VectorVest Simulator
- VectorVest Variator
- VectorVest Watchdog
