

HOT TOPICS LIST
- MACD
- Fibonacci
- RSI
- Gann
- ADXR
- Stochastics
- Volume
- Triangles
- Futures
- Cycles
- Volatility
- ZIGZAG
- MESA
- Retracement
- Aroon
INDICATORS LIST
LIST OF TOPICS
PRINT THIS ARTICLE
by Mark Rivest
Patterns from four stock market peaks could reveal the near future.
Position: Sell
Mark Rivest
Independent investment advisor, trader and writer. He has written articles for Technical Analysis of Stocks & Commodities, Traders.com Advantage,Futuresmag.com and, Finance Magnates. Author of website Four Dimension Trading.
PRINT THIS ARTICLE
MARKET TIMING
Anatomy of a Stock Market Top
07/07/17 03:45:42 PMby Mark Rivest
Patterns from four stock market peaks could reveal the near future.
Position: Sell
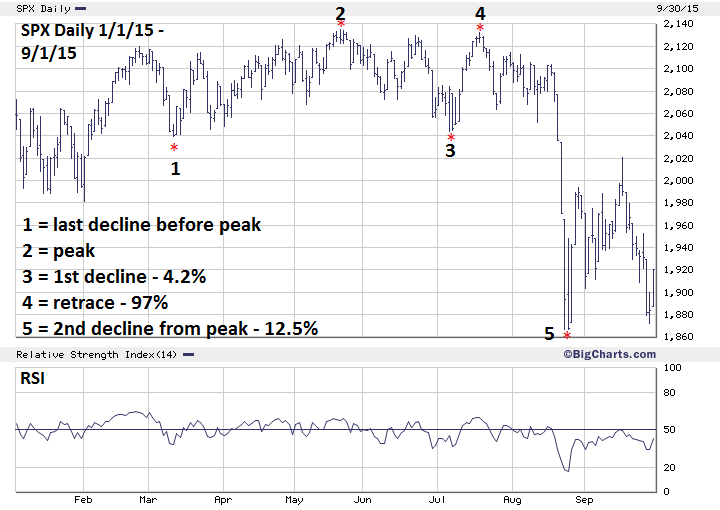
| The June 19, 2017 S&P 500 (SPX) all-time high of 2453.82 — only .28 below major Fibonacci resistance — could be at least an intermediate peak leading to a 15-20% decline. On June 29, 2017, the Nasdaq 100 (NDX) broke below important support at the double bottom of 5633 and 5634. Prior to its June 9 peak the NDX had been one of the strongest US stock indexes and led the bull market. Now the NDX is one of the weakest indexes and leading the way down. The SPX hitting major resistance with NDX weakness is powerful evidence that a stock market decline has begun. Evidence from the last four SPX significant tops could give important clues of what to expect in the next three to five months. S&P 500 - 2015 Top After a significant stock market bottom is made from at least a 15-20% decline, the crowd is afraid of stocks and view rallies as opportunities to sell stocks. New declines are believed to be a resumption of the bear trend. After several months of stocks rising without a significant decline, the crowd learns how to play the market. Declines are now viewed as opportunities to buy stock and are welcomed. This epiphany usually comes about two thirds into a bull trend. When a significant peak occurs, the crowd is blissfully unaware their portfolios are on the precipice of a severe reduction. This cycle repeats over and over again. The speculator that can separate themselves from the crowd can profit from the cycle. Please see the Daily SPX 2015 chart illustrated in Figure 1. At the dawn of 2015 it was more than three years since the last significant stock market decline and the crowd was ultra-complacent. The following is a template for a significant stock market peak. 1) Final bull market correction before significant top. 2) Peak – on May 20, 2015 SPX reaches 2134.72, less than four points below major Fibonacci resistance. 3) First decline – about one and a half months after peak, decline of 4.2% bottoms above final bull market correction. 4) Retrace – exactly two months after peak, secondary top retraces 97% of the decline. Normally, retracements of declines would stop at Fibonacci 62%. After the first bear market decline, the crowd thinks the bull market is still alive and they're eager to buy stocks. 5) Second decline is where most of the bear move occurs. This one ended just three months after the peak with a total decline of 12.5%. Subsequently, the bulls were in control for over two months before the intermediate correction resumed, completing in February 2016, only 57 SPX points below the August 2015 bottom. For more information about the SPX 2015 decline see my following articles; May 27, 2015 "The Battlefield", June 8, 2015 "The Golden Section", and July 30, 2015 "A Ludicrous Non-Confirmation". |
|
| Figure 1. When a significant peak occurs, the crowd is blissfully unaware their portfolios are on the precipice of a severe reduction. |
| Graphic provided by: BigCharts.com. |
| |
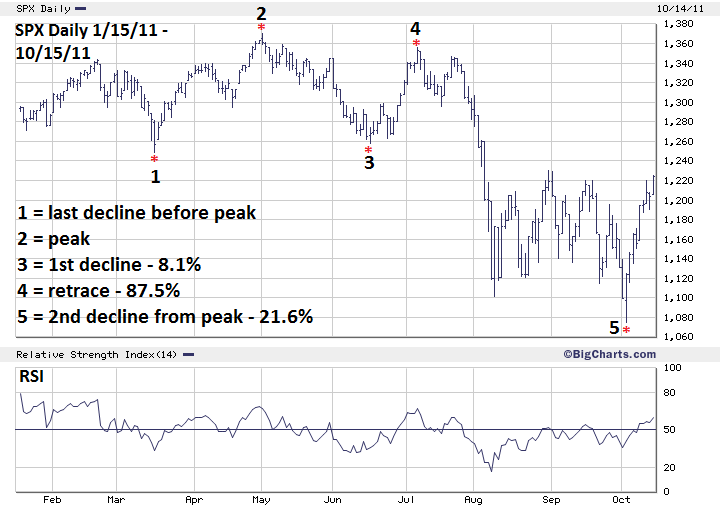
| S&P 500 - 2011 Top Please see the Daily SPX 2011 chart illustrated in Figure 2. This peak reveals several similarities with the 2015 top. 1) Final bull market correction before a significant top. 2) Peak – May 2, 2011, seasonally tops usually occur April-May. 3) First decline – about one and a half months after peak, decline of 8.1% bottoms above final bull market correction. 4) Retrace – just over two months after the peak is a deep 87.5%. 5) Second decline contains the bulk of the bear move, ending just five months after the peak with a 21.6% drop from May 2nd. |
|
| Figure 2. Peak – May 2, 2011. Seasonally, tops usually occur between April-May. |
| Graphic provided by: BigCharts.com. |
| |
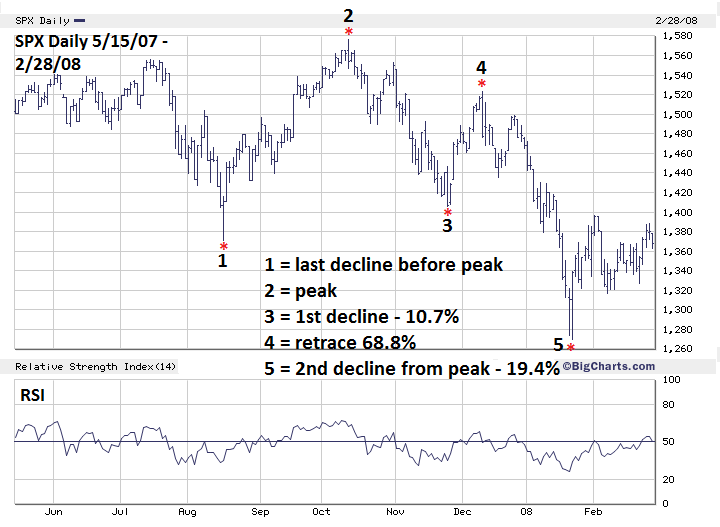
| S&P 500 - 2010 and 2007 Tops The 2010 peak deviates the most from the tops made in 2007, 2011 and 2015, yet it still has some striking similarities. 1) Final bull market correction ended on February 5, 2010 at SPX 1044.50. 2) Peak – April 26, 2010 in seasonal topping zone. 3) First decline – bottoms at SPX 1065.80, above the final bull market correction. Decline lasts only eight trading days — probably because the last day of the drop was the infamous May 6, 2010 flash crash. 4) Retrace – of 70.1% in just four trading days. 5) Second decline is only marginally larger than the first and bottoms on July 1, just over two months after the peak. Total decline from the top is 17.1%. Please see the Daily SPX 2007 chart illustrated in Figure 3. The 2010, 2011 and 2015 tops gave births to intermediate corrections of a larger ongoing eight-year bull market. The 2007 high was a major top marking completion of a five-year bull market. 1) Final bull market correction before a significant top. 2) Peak – all-time high SPX 1576 on October 11, 2007. 3) First decline – about one and a half months after the peak, decline of 10.7% bottoms above final bull market correction. 4) Retrace – exactly two months after the peak is 68.8%. 5) Second decline contains the bulk of the drop after the peak and completes in three months with a total drop of 19.4%. The big difference with the other post peak declines is that the October 2007 - January 2008 drop was just the first phase off a much larger bear market. After the January 24, 2008 bottom the SPX rallied, had a marginal new low on March 17, 2008, then completed the counter trend move up on May 19, 2008 in the seasonal topping zone at 1440. The SPX then fell for the next ten months, bottoming at 666. |
|
| Figure 3. Peak – All-time SPX high at 1576 on October 11, 2007. |
| Graphic provided by: BigCharts.com. |
| |
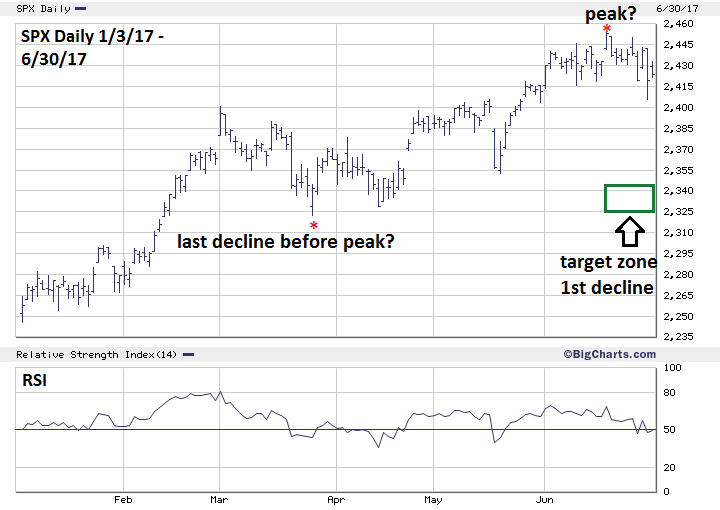
| S&P 500 - 2017 Please see the SPX 2017 chart illustrated in Figure 4. Assuming a significant top is in place at SPX 2453, based upon the studies of the last four SPX tops there is a high probability of the decline ending near and above 2322. The crowd has again probably learned how to play the stock market and view the last correction that ended in March as a buying zone. If the decline continues it may bottom as soon as July 19 based upon two factors. 1) The Elliott wave intraday count from June 19-30 is very bearish implying a sharp decline after July 5. 2) The SPX continued to rally weeks after the seasonal topping zone. It may want to make up for this by falling rapidly. Decline could end in the zone of July 12-21. |
|
| Figure 4. Decline could end in the zone of July 12�21. |
| Graphic provided by: BigCharts.com. |
| |
| Summary and Strategy Trading the markets is like baseball or the card game blackjack — you want to play the higher percentage probabilities. Here are the common characteristics of the declines after the last four significant SPX tops. 1) The first decline bottoms above the final bull market correction. 2) The retracement of the first decline is deep. 3) The second decline is deeper than the first decline. Unless within the next few weeks the SPX makes a new all-time high or goes below the March bottom at 2322, there is very high probability of a near term bottom just above 2322. Hold short 50% stocks and use SPX 2510 as a stop loss. An old Wall Street adage — "Just when you find the key to the market, they change the locks" The last significant stock market decline was more than sixteen months ago, and the bull market is over eight years old, so it's a safe guess the crowd thinks they've "found the key". Separate yourself from the crowd, the locks have probably been changed. You can profit from this knowledge. Further Reading: Rivest Mark 6/30/17 "S&P 500 Hits Major Resistance!", Traders.com Advantage. |
Independent investment advisor, trader and writer. He has written articles for Technical Analysis of Stocks & Commodities, Traders.com Advantage,Futuresmag.com and, Finance Magnates. Author of website Four Dimension Trading.
| Website: | www.fourdimensiontrading.com |
| E-mail address: | markrivest@gmail.com |
Click here for more information about our publications!
Comments

Request Information From Our Sponsors
- StockCharts.com, Inc.
- Candle Patterns
- Candlestick Charting Explained
- Intermarket Technical Analysis
- John Murphy on Chart Analysis
- John Murphy's Chart Pattern Recognition
- John Murphy's Market Message
- MurphyExplainsMarketAnalysis-Intermarket Analysis
- MurphyExplainsMarketAnalysis-Visual Analysis
- StockCharts.com
- Technical Analysis of the Financial Markets
- The Visual Investor
- VectorVest, Inc.
- Executive Premier Workshop
- One-Day Options Course
- OptionsPro
- Retirement Income Workshop
- Sure-Fire Trading Systems (VectorVest, Inc.)
- Trading as a Business Workshop
- VectorVest 7 EOD
- VectorVest 7 RealTime/IntraDay
- VectorVest AutoTester
- VectorVest Educational Services
- VectorVest OnLine
- VectorVest Options Analyzer
- VectorVest ProGraphics v6.0
- VectorVest ProTrader 7
- VectorVest RealTime Derby Tool
- VectorVest Simulator
- VectorVest Variator
- VectorVest Watchdog