

HOT TOPICS LIST
- MACD
- Fibonacci
- RSI
- Gann
- ADXR
- Stochastics
- Volume
- Triangles
- Futures
- Cycles
- Volatility
- ZIGZAG
- MESA
- Retracement
- Aroon
INDICATORS LIST
LIST OF TOPICS
PRINT THIS ARTICLE
by Mark Rivest
See why the S&P 500 reaching 2453.82 could be a major peak.
Position: Sell
Mark Rivest
Independent investment advisor, trader and writer. He has written articles for Technical Analysis of Stocks & Commodities, Traders.com Advantage,Futuresmag.com and, Finance Magnates. Author of website Four Dimension Trading.
PRINT THIS ARTICLE
SUPPORT & RESISTANCE
S&P 500 Hits Major Resistance!
06/30/17 12:13:40 PMby Mark Rivest
See why the S&P 500 reaching 2453.82 could be a major peak.
Position: Sell
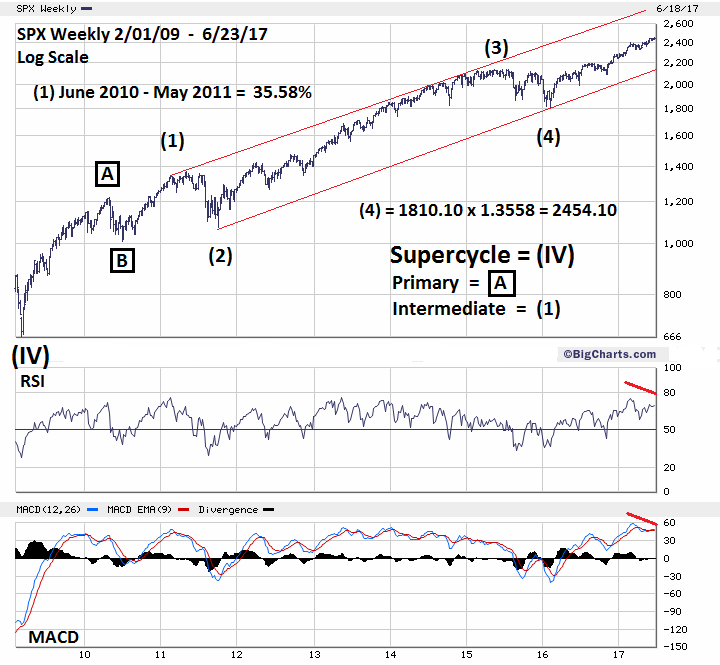
| When using Fibonacci price analysis to discover support/resistance for any market you should allow for leeway, exact hits are few and far between. For example, when analyzing the daily S&P 500 (SPX) use a leeway of perhaps 5 to 10 points. For multi-year analysis, leeway could be 40 to 50 points. On June 19, 2017, the SPX reached an all-time high of 2453.82 — only .28 of a point away from a major Fibonacci resistance coordinate. If the top holds, it could be the start of a multi-month decline of at least 20%. S&P 500 Eight Year Bull Market Please see the weekly SPX chart illustrated in Figure 1. This is an update to the weekly SPX chart illustrated in my March 15th article, "Discovering Fibonacci Price Targets". Typically, in an Elliott impulse pattern, wave "one" will equal wave "five". When comparing price structures where there's been a large percentage gain, it's best to compare growth rates rather than points. The SPX June 2010-May 2011 bull phase was a 35.58% rally. Adding this growth rate to the supposed wave "four" bottom at 1810.10 targets 2454.10 — the June 19 high of 2453.82 is almost an exact hit! This precision rarely happens on a multi-year scale and is potentially a very powerful signal. There's also another long-term Fibonacci coordinate in proximity to the primary coordinate of 2454.10. The May 2015 SPX peak at 2134.70 to the February 2016 bottom of 1810.10 was 324.60 points x 2 = 649.20 added to 1810.10 targets 2459.30. If the SPX can breach the high at 2453.82 it could top closer to 2459.30. Even this near-term bullishness is doubtful when you factor in evidence from the dimensions of momentum and sentiment. |
|
| Figure 1. There�s also another long-term Fibonacci coordinate in proximity to the primary coordinate of 2454.10. |
| Graphic provided by: BigCharts.com. |
| |
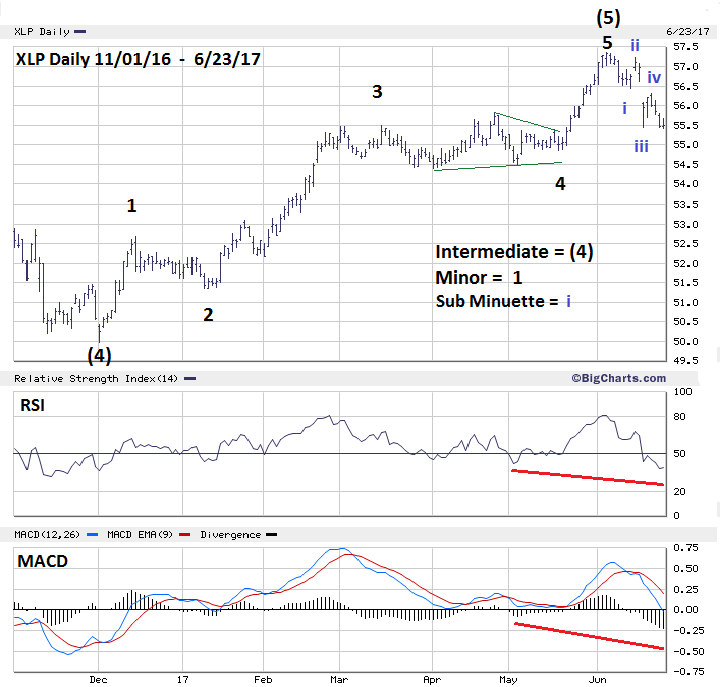
| S&P 500 Sector Analysis During the second half of 2016 the SPDR sector ETF for Consumer Staples (XLP) was much weaker than the SPX. This is unusual as the companies in this sector make essential products, and their stocks are normally the last to peak in a bull market. XLP made a top on July 14, 2016 at 56.02 then declined until bottoming on December 1, 2016 at 49.98. The next XLP rally didn't exceed the 2016 high until May 25, 2017 — after months of the SPX making all-time highs. This continued lagging of an important sector is a clue of a broader stock market top developing, and there's more. Please see the Daily XLP chart illustrated in Figure 2. The XLP rally from December 1st to its high on June 5th is a text book Elliott wave impulse pattern, and implies at least a multi-week correction of the rally from December 1. The decline from the June 5 top appears to be a developing five wave pattern which could be the first wave down of a larger developing decline. Daily RSI and MACD are at deeper oversold levels than recorded at the last decline, implying the current drop will go below the last correction bottom. It's not just the XLP that is exhibiting evidence of weakness verses the SPX. Of the nine SPDR sector funds only two confirmed the SPX all-time high of June 19th, XLI - Industrials and XLV - Health Care. During the recent Technology sector (XLK) sell off, there was a comment in the media celebrating that the Financial sector (XLF) was rallying. Here's a news flash: the XLF topped on March 2 and the rally it had in the face of the XLK decline could be just a correction of a larger developing bear market. |
|
| Figure 2. The XLP rally from December 1 to its high on June 5 is a textbook Elliott wave impulse pattern. |
| Graphic provided by: BigCharts.com. |
| |
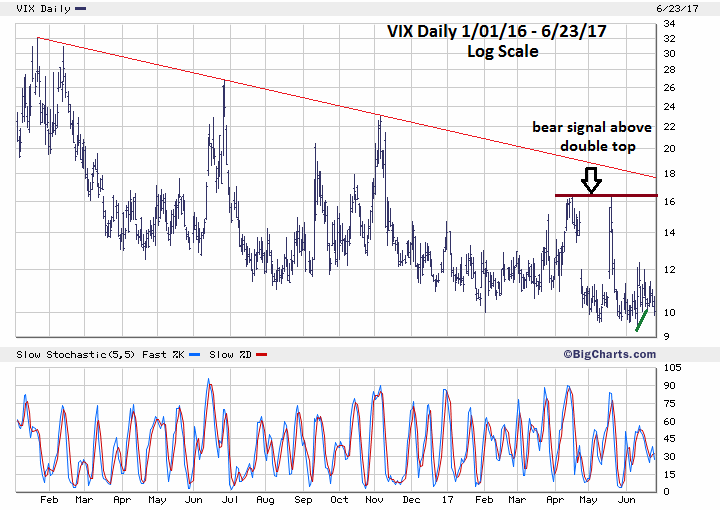
| Sentiment Dimension Please see the Daily VIX chart illustrated in Figure 3. My June 23 article "Messages from a Split Stock Market-Part Two" noted a weak VIX divergence signal made on June 13. On June 19, The SPX had a stronger signal — making an intra-day and closing high accompanied by VIX close above its low made on June 9. This divergence could be a signal for at least a multi-week decline. The longer- term sentiment picture remains bearish. The Market Vane Bullish Consensus reading for stocks the week of June 19-23 was 69%. This is a high reading and indicates a potential topping zone for stocks, and a divergence from the bull markets highest reading of 70% made in May 2013. |
|
| Figure 3. On June 19, The SPX had a stronger signal - making an intra-day and closing high accompanied by VIX close above its low made on June 9. |
| Graphic provided by: Bigcharts.com. |
| |
| Summary and Strategy SPX hitting a major Fibonacci coordinate on June 19 and subsequently moving down is powerful evidence an important top could be in place. There could be a test or even a significant move above this top, however seven sectors failing to confirm the peak accompanied by bearish sentiment signals make this a low probability scenario. Hold 50% short stocks, use SPX 2510 as a stop loss. A bulls-eye hit of a long-term Fibonacci coordinate is the equivalent to Golf's hole-in-one. It's thrilling, but not necessary to winning the game. Our goal as market analyst/speculators is like the golfer — to get on the green. The cumulative bearish evidence from the dimensions of price, sentiment and momentum tell us we are on the green, and prepared for a stock market decline. Stock market analyst/speculators ignorant of this evidence aren't even on the golf course. Further Reading: Frost A.J and Robert Prechter (1985) "Elliott Wave Principle", New Classics Library. |
Independent investment advisor, trader and writer. He has written articles for Technical Analysis of Stocks & Commodities, Traders.com Advantage,Futuresmag.com and, Finance Magnates. Author of website Four Dimension Trading.
| Website: | www.fourdimensiontrading.com |
| E-mail address: | markrivest@gmail.com |
Click here for more information about our publications!
PRINT THIS ARTICLE

Request Information From Our Sponsors
- StockCharts.com, Inc.
- Candle Patterns
- Candlestick Charting Explained
- Intermarket Technical Analysis
- John Murphy on Chart Analysis
- John Murphy's Chart Pattern Recognition
- John Murphy's Market Message
- MurphyExplainsMarketAnalysis-Intermarket Analysis
- MurphyExplainsMarketAnalysis-Visual Analysis
- StockCharts.com
- Technical Analysis of the Financial Markets
- The Visual Investor
- VectorVest, Inc.
- Executive Premier Workshop
- One-Day Options Course
- OptionsPro
- Retirement Income Workshop
- Sure-Fire Trading Systems (VectorVest, Inc.)
- Trading as a Business Workshop
- VectorVest 7 EOD
- VectorVest 7 RealTime/IntraDay
- VectorVest AutoTester
- VectorVest Educational Services
- VectorVest OnLine
- VectorVest Options Analyzer
- VectorVest ProGraphics v6.0
- VectorVest ProTrader 7
- VectorVest RealTime Derby Tool
- VectorVest Simulator
- VectorVest Variator
- VectorVest Watchdog