

HOT TOPICS LIST
- MACD
- Fibonacci
- RSI
- Gann
- ADXR
- Stochastics
- Volume
- Triangles
- Futures
- Cycles
- Volatility
- ZIGZAG
- MESA
- Retracement
- Aroon
INDICATORS LIST
LIST OF TOPICS
PRINT THIS ARTICLE
by Mark Rivest
See why Nasdaq 100 underperformance could signal an imminent decline.
Position: Sell
Mark Rivest
Independent investment advisor, trader and writer. He has written articles for Technical Analysis of Stocks & Commodities, Traders.com Advantage,Futuresmag.com and, Finance Magnates. Author of website Four Dimension Trading.
PRINT THIS ARTICLE
MARKET TIMING
Messages from a Split Stock Market - Part Two
06/23/17 03:18:51 PMby Mark Rivest
See why Nasdaq 100 underperformance could signal an imminent decline.
Position: Sell
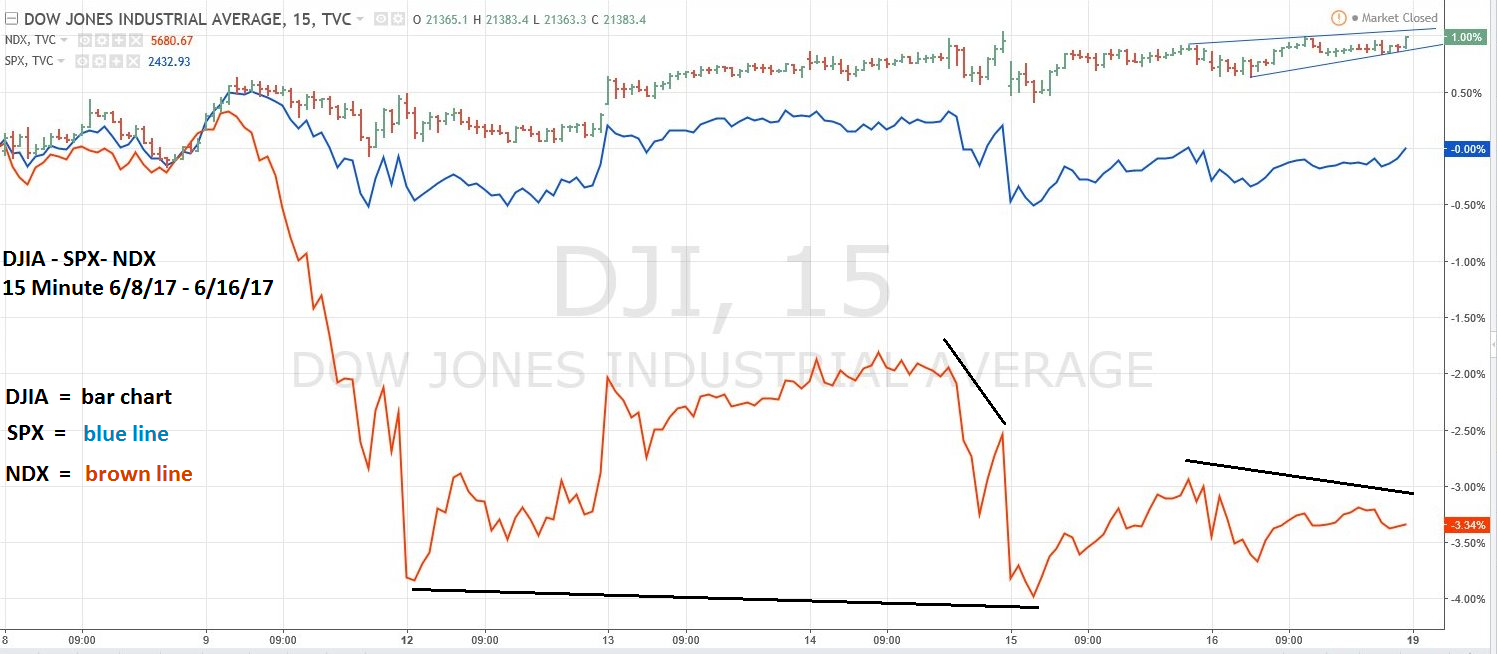
| On June 9, 2017 — a full moon day — the Dow Jones Industrial Average (DJIA), S&P 500 (SPX), Nasdaq Composite (COMP) and Nasdaq 100 (NDX) made all-time highs. From the beginning of 2017 to the highs made on June 9, NDX had been the strongest index +21% vs. COMP +17%, SPX +9%, and DJIA +7%. Since June 9, NDX has become the weakest index. This dramatic shift signals near term bearishness for the US stock market and could be the prelude to a long and deep bear market. Comparison of Stock Indices The late 1990's had the biggest stock market mania since the late 1920's. The 1990's stock boom was led mostly by technology stocks within the NDX. In 1999, the NDX was up a spectacular 101% vs. the DJIA rise of 22%. During the nearly three-year bear market following the major top in 2000 NDX continued to lead, this time to the downside. From the peak made in 2000 to the bottom made in October 2002 the NDX declined 83% vs. an SPX 50% decline and DJIA 38% decline. On October 8, 2002, all three indices made new bear market lows. October 9, 2002, the DJIA and SPX continued to make new lows unconfirmed by the NDX. October 10, 2002, both the DJIA and SPX made their final bear market lows and finished up on the day, while NDX still held above its October 8 bottom. For nearly three years the NDX had been leading the way down, pulverized and punished more than any major US stock index, then October 9-10, 2002, it showed strength relative to the other indices. A powerful signal for the birth of a bull market which lasted for five years. Please see the daily DJIA-SPX-NDX 15-minute chart illustrated in Figure 1. My June 14 article "Messages from a Split Stock Market" noted three factors that indicated the DJIA could rally to at least its all-time high. Also, analysis of the SPX indicated a possible peak on June 13 or 14. The DJIA did make a new high on June 14, unconfirmed by both the SPX and the NDX. This important non-confirmation is powerful evidence of a potential peak. The weakness of the NDX is even more powerful. This is what the NDX has done since its sharp decline on June 9: 1) Went below its June 9 bottom on June 12, and on June 15 the 15-minute close chart went below its June 12 bottom. *note on the 15-minute bar chart held marginally above the June 12 bottom. 2) Had a huge non-confirmation with the DJIA all-time high on June 14th. 3) Continued to show weakness vs. the DJIA rally of June 15-16. If the NDX breaks below the double bottom at 5633.30 and 5634.60 it opens the door for a decline to the NDX 5350.00 area. |
|
| Figure 1. If the NDX breaks below the double bottom at 5633.30 and 5634.60, it opens the door for a decline to the NDX 5350.00 area. |
| Graphic provided by: Tradingview.com. |
| |
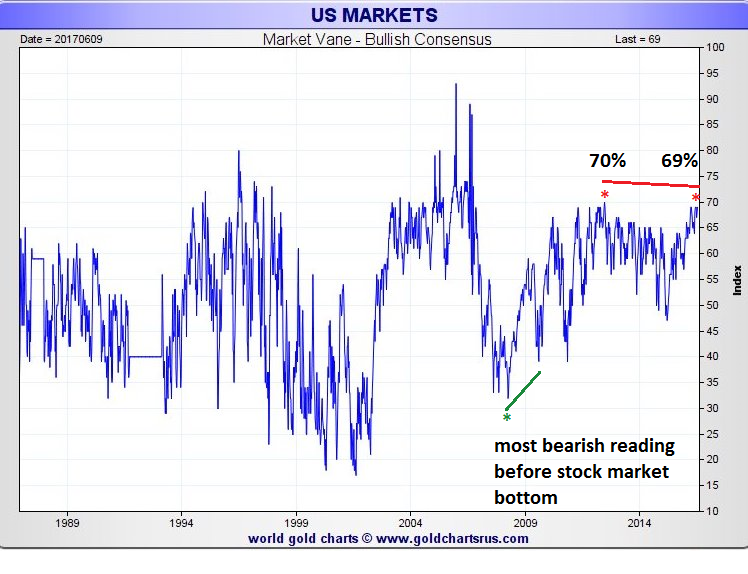
| Sentiment Dimension On June 9, the VIX made a new low signaling a possible SPX rally, which it did, reaching a new closing high on June 13 at 2440.40. However, the SPX failed to make a new all-time high on June 14, missing by 2.40 points. It would be stronger evidence of a bearish divergence if the SPX also made an all-time high on June 14. Please see the Market Vane chart illustrated in Figure 2. R. Earl Hadady developed the Market Vane - Bullish Consensus in which futures traders in various markets are polled as to their opinion about the markets they trade. A very high reading indicates a potential market top. A very low reading means a possible bottom. The strongest indication of a turn come on divergences. The highest reading for the eight-year bull market came in 2013 at 70%. Since early May 2017, five of the last seven readings have been at 69%. This is both a long and short- term divergence. The SPX is about 1.5% higher from early May 2017. |
|
| Figure 2. Since early May 2017 five of the last seven readings have been at 69%. |
| Graphic provided by: goldchartsrus.com. |
| |
| Conclusion and Strategy The NDX has not only been the strongest US stock index for 2017, it has been the strongest index since the start of the bull market in 2009. The NDX is up 4.6 times its March 2009 bottom vs. 2.6 times the SPX and 2.3 times for the DJIA. The recent incredible weakness relative to the other indices is a powerful signal the trend could change to the downside. My May 31st article "The Bear Awakens" recommended shorting 50% stocks if the SPX moved above 2420. Hold short 50% stocks and use SPX 2510 as a stop loss. Very short term it appears the DJIA could rally to just above 24,100. If the DJIA peaks in this area, the next NDX decline could see a break below the 5633-5634 bottom and a SPX break below 2415.70. The break of SPX 2415.70 could open the door to support at 2320-2340. The NDX has been leading the US stock market for several years. Perhaps since June 9 it's leading the way down. Further Reading: Hadady R. Earl (1983) "Contrary Opinion", Key Books. |
Independent investment advisor, trader and writer. He has written articles for Technical Analysis of Stocks & Commodities, Traders.com Advantage,Futuresmag.com and, Finance Magnates. Author of website Four Dimension Trading.
| Website: | www.fourdimensiontrading.com |
| E-mail address: | markrivest@gmail.com |
Click here for more information about our publications!
Comments
Date:�06/29/17Rank:�Comment:�Very good analysis and helps to keep the global picture rooted in reality. Hopefully will help in avoiding being swept by manic waves.

Request Information From Our Sponsors
- StockCharts.com, Inc.
- Candle Patterns
- Candlestick Charting Explained
- Intermarket Technical Analysis
- John Murphy on Chart Analysis
- John Murphy's Chart Pattern Recognition
- John Murphy's Market Message
- MurphyExplainsMarketAnalysis-Intermarket Analysis
- MurphyExplainsMarketAnalysis-Visual Analysis
- StockCharts.com
- Technical Analysis of the Financial Markets
- The Visual Investor
- VectorVest, Inc.
- Executive Premier Workshop
- One-Day Options Course
- OptionsPro
- Retirement Income Workshop
- Sure-Fire Trading Systems (VectorVest, Inc.)
- Trading as a Business Workshop
- VectorVest 7 EOD
- VectorVest 7 RealTime/IntraDay
- VectorVest AutoTester
- VectorVest Educational Services
- VectorVest OnLine
- VectorVest Options Analyzer
- VectorVest ProGraphics v6.0
- VectorVest ProTrader 7
- VectorVest RealTime Derby Tool
- VectorVest Simulator
- VectorVest Variator
- VectorVest Watchdog